Published in Journal18: a journal of eighteenth-century art and culture
Issue 5: Coordinates: Digital Mapping and 18th-Century Visual, Material, and Built Cultures (Spring 2018)
Edited by Carrie Anderson and Nancy Um
Agent
1 term 2018-01-30T01:43:08-08:00 Lauren Cesiro f37e4e52c3d9a4ff08b7937020ee9048f11c6739 22915 1 Annotation plain 2018-01-30T01:43:08-08:00 Lauren Cesiro f37e4e52c3d9a4ff08b7937020ee9048f11c6739This page is referenced by:
-
1
media/NewLalande.jpg
media/Robineau.jpg
2017-09-28T10:28:39-07:00
Displacement #3: Itinera as Code
86
Vibeka McGyver
image_header
2018-02-22T21:02:17-08:00
As a first-year computer science student, I was initially introduced to Itinera through the opportunity to work on a long-term project focused on updating Itinera’s “Travelers” visualization. The Travelers visualization was initially very intimidating to me. I was not familiar with the historical aspect of the data, and I had no idea how the code worked. Over the past four semesters of working on Itinera as a student, I have had many new and important learning experiences. This project has increased my understanding of how to work with data, specifically unfamiliar data. I have also had the experience of working in a computer lab environment with a team of people who are all engaged with different parts of the same project. In the lab, I have learned the value of having an understanding of everyone else’s contributions, processes, and goals. Over this time, I have also developed a better understanding of the value of Computer Science in combination with Art History and other disciplines. The process of teaching myself a new programming style has also resulted in a fair deal of trial and error, which has frequently led me into and out of rabbit holes. I can now better distinguish these rabbit holes and climb out of them more quickly than I could in the beginning. I have learned the value of what a data visualization can offer to students, researchers, and anyone curious about data relationships. Working on Itinera has been a very informative opportunity due to all of the different approaches I have experimented with and the many challenges I have been faced with.
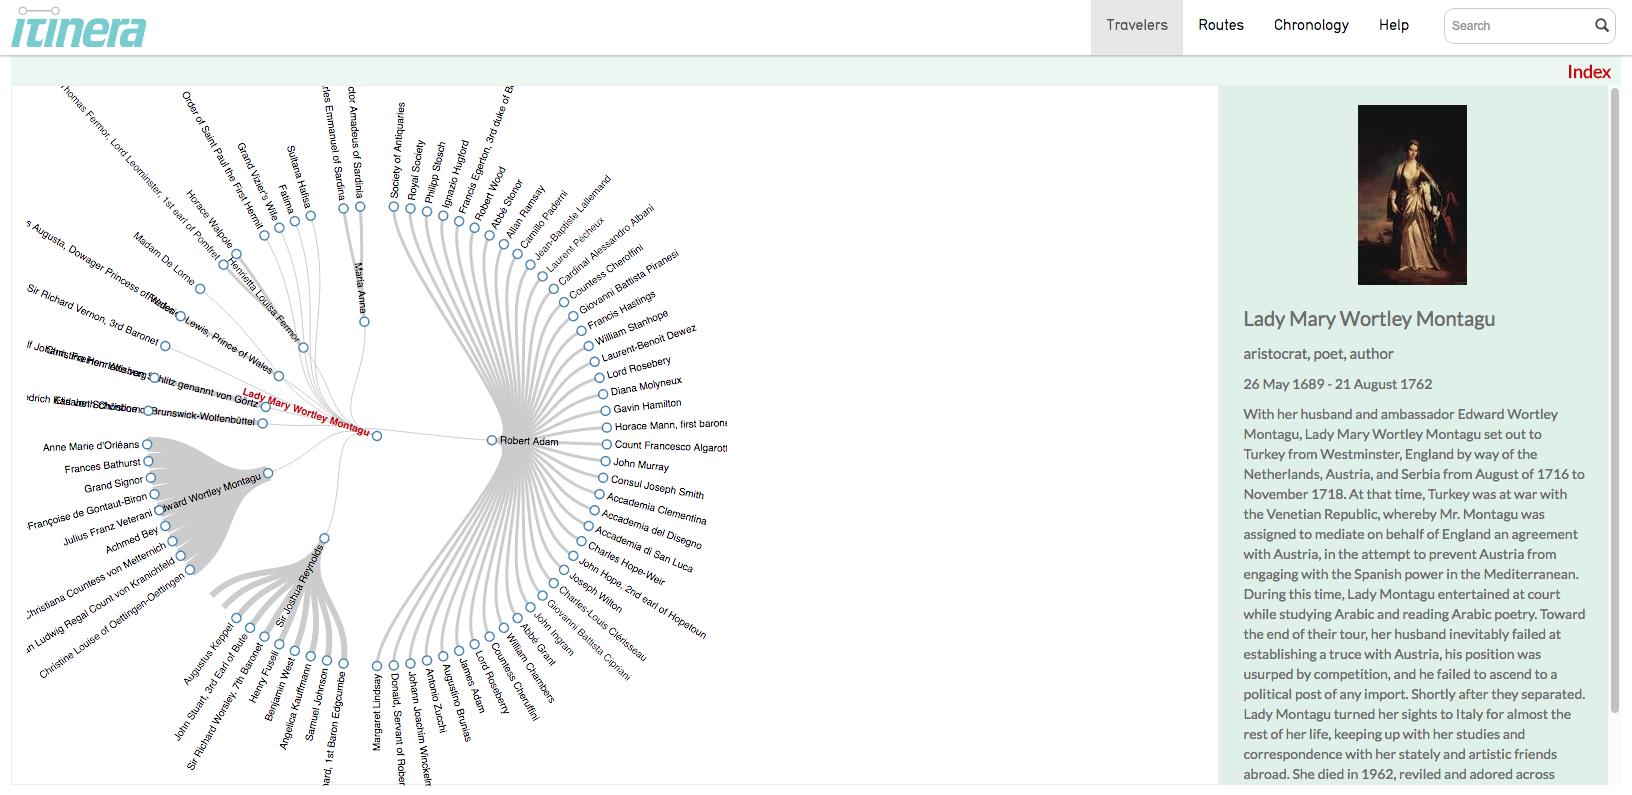
In the beginning, I did not know where to start, so one of Alison’s lab project managers, Sarah, helped guide me through the initial steps. The first step was to increase my familiarity with Itinera’s current functionality. The best way to do this was to spend time looking at the functionality of the JavaScript visualization from the front-end. For reference, the back end of the Itinera code (the code that runs the visualization) was not a part of my learning experience until three semesters later. Instead I began learning by simply interacting with the current Travelers visualization (Figure 1), starting by selecting an agent from the red index tab located at the top right of the visualization. The green box on the right of the screen provides information about the selected agent, such as the name, an image, and life achievements. The surrounding blue dots and corresponding names are the central agent's related agents. To change the central agent, the user can either select a new agent by clicking another blue dot on the visualization, or choose a different name from the index. Then, the new selected agent will appear in red at the center, surrounded by his or her social relationships.This step, of familiarizing myself with the basics of Itinera, such as how the current visualization performs and how the data is presented, provided an incredibly important foundation. Just by clicking through the visualization, I was able to recognize patterns and form an idea of how the code might work. This was a small but important first move because I was able to compose my own understanding before being overwhelmed by completely new and unfamiliar code. I was also able to develop ideas about how to critically approach a more informative visualization in the future.
One part of the visualization that initially confused me was the cloud of unfamiliar names. Clicking on any name would produce another cloud of unfamiliar names. I was very concerned that it would be difficult to work on the code without also being familiar with eighteenth-century history. After four semesters of seeing the same names, I eventually created my own understanding of the relationships and agents in Itinera. Although I don’t have a historically based understanding of these names, repetition and curiosity have led me to form my own connections and understandings about the data. Similar roadblocks have appeared throughout my work on the project. It takes effort to recognize these roadblocks and remind myself that I cannot let them stop my productivity. It is much more productive to consider what I do know, rather than what I do not. I may not understand the history of these names, families, and relationships, but the purpose of being able to code is to use a computer to assist in developing such an understanding. Many times, I’ve had to refocus myself on the small steps that are the foundation for taking bigger steps.
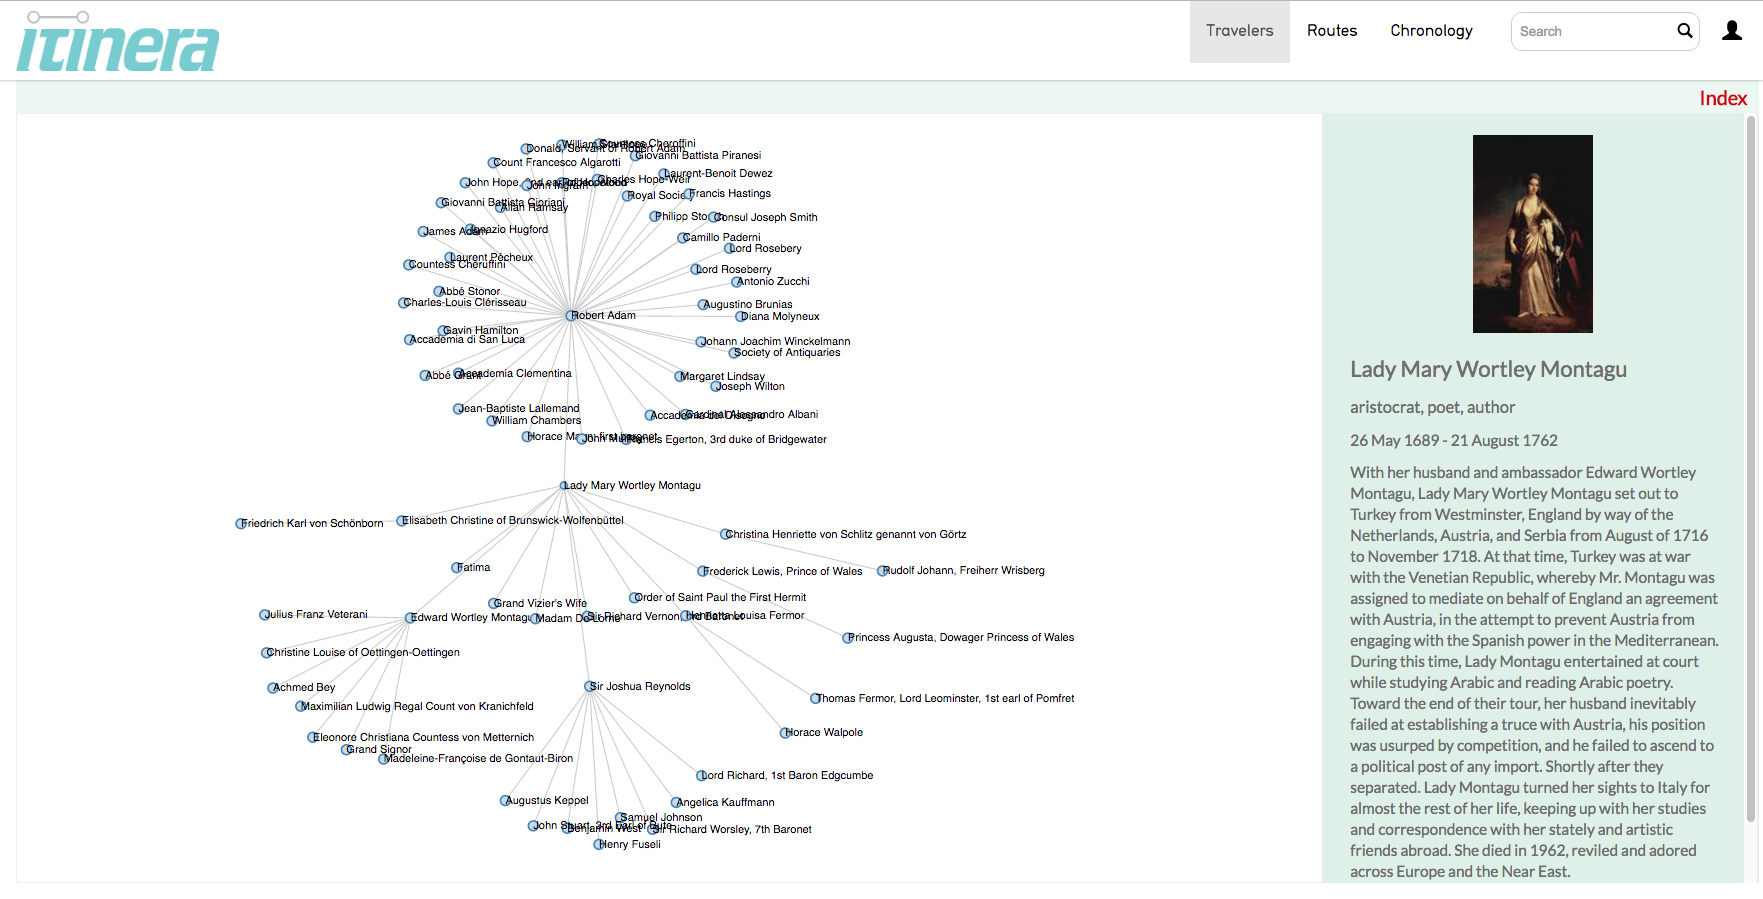
After forming an understanding of Itinera from a user's perspective, I began learning JavaScript D3. D3 is the JavaScript library that the current Travelers visualization uses. D3 has been very challenging for me to learn and understand because I have not yet had the chance to take a formal JavaScript class in school. Without web-based coding training, the learning process was slower, which was very discouraging for me at times. A major benefit in working with D3, however, is that there are premade templates, meaning that examples of the complex and difficult code are freely offered as starting places for the coder. The final goal of my project is to utilize the D3 “Force-Directed Graph” template written by Mike Bostock to successfully create an enhanced representation of Itinera’s Travelers data. To the viewer, this will provide a descriptive and interactive visualization of the relationships between all of Itinera’s agents. When completed, viewers will be able to look at multiple agents’ relationships at a time or zoom in to look at more personalized relationships (Figure 2). This customization is important because it allows the user to tailor the visualization to specific needs. It also improves upon the current radial model (Figure 1), which can only generate one set of social relationships at a time.
One of my major goals is to make the template function properly, relying on other online examples, including those presented in tutorials. Yet, these models have limited use because they all rely upon small and pre-formatted amounts of data, already structured to work perfectly with the sample visualization code. Itinera’s data is formatted in a much more complex way. There have been many times that I found it difficult to understand how to proceed with large amounts of data. I still do not feel I truly understand it properly, but I am approaching a point where I can begin to understand the appropriate process. The feeling of being stuck, especially with the large amount of resources online, has been challenging. I have tried to escape rabbit holes by breaking the code down, line by line. Reading lines of code like paragraphs in a book does not always work in an expected way due to the overwhelming amount of information. Instead, reading each word and connecting it with a meaning has been a more productive route of working through problems.
Aside from the code, I have learned to represent the data that my colleagues have spent a long time gathering and researching accurately and informatively. Working on Itinera has helped me understand how very different disciplines can successfully work together. Art History, Digital Media, and Computer and Data Sciences are incredibly interesting when combined into a single project, such as Itinera, and develop the potential to provide new and complex historical understandings.
-
1
media/NewLalande.jpg
media/Humboldt.jpg
2017-09-30T21:39:07-07:00
Displacement #1: Itinera as Methodology
86
Jennifer Donnelly
image_header
2018-02-22T20:52:01-08:00
Itinera approaches historical information from a very different theoretical standpoint than that of a traditional dissertation, book, or article project. A written history typically unfolds within a linear narrative. The author shapes, mediates, and manipulates the raw data that are history's primary sources. By working with Itinera, I learned to challenge the implicit sequencing of the historical narrative by subjecting this same information to a standardized set of curated criteria and presenting it as structured data through dynamic visualizations that map mobile collections of humans and objects in space and time, but do not necessarily adhere to fixed developmental or teleological frameworks.
My work on Alexander von Humboldt’s South American and Russian expeditions, which I began for the purposes of working as Itinera's project manager, focuses on the interactions of people moving across the globe, making use of the possibilities and affordances of Itinera’s non-linear, non-hierarchical approach to represent both the mobility of people and objects. Humboldt traveled the world taking measurements and collecting data, hoping to trace the universal geographies of natural history. Humboldt serves as an effective example that can demonstrate the potential of Itinera as both a graphic model of data visualization and also, more theoretically, a methodological approach that can be useful beyond Itinera's boundaries.
The fundamental building block of Itinera is the life event, a record of a specific event in the life of an Itinera agent. The data collected to record a life event in Itinera includes geographically specific information, which can be a specific street address or a more general place, such as "Rome," a timestamp, which can be the exact time of day in which an event takes place or a series of days or weeks, and links to a series of other actors, who also participated in that life event at that specific place and time. This data is mined from historical narratives, memoirs, travel diaries, and other types of records that typically conform to a more conventional narrative format. Each actor is associated with his or her own unique timeline of life events and an agent profile that records, among other things, his or her date and place of birth and death, life role or occupation, and any pertinent familial or professional relationships. All of the relationships between time, place, and historical actor are carefully recorded into Itinera according to a defined schema. However, Itinera does not entirely avoid narrative history. The “description” portion of the life event is the only component that requires a traditional narrative account, and it is often in these narratives that the drama of human experience comes to life.
The Itinera user can then access this data through several different visualizations on the front end of the interface, which provides graphic modes of picturing journeys, social relationships, and biographies. When viewed through the "Routes" visualization, Humboldt's voyage on Itinera reads, like all journeys on Itinera, as a series of dots snaking across the globe. Fragmented groups cluster in Europe, a long, irregular line cuts across Russia, and two twisting paths meander along the western edge of South America and Venezuela. (Figure 1) A single dot highlights the Canary Islands and a few marks accumulate in the United States, Cuba, and Mexico. With these specified points, the map itself gives a sense of the chronology of Humboldt's journey, but speaks more to the dispersed sites and the spatial density of his life experiences. A scroll along the bottom of the map allows the user to manage the dates of travel displayed on the map. Each dot itself opens into a window with a painting of Humboldt taking notes, the location and date of each of Humboldt’s life events and a description of the events that unfolded at that place and time.The Networks Visualization cuts across these life events in a different way, allowing convergences between selected historical actors to emerge. As more and more users add data to Itinera, these networks will become richer and denser. Itinera flattens traditional hierarchies of historical importance or preeminence. Connectivity emerges between known historical actors, such as Alexander von Humboldt and Johann Wolfgang von Goethe, as well as lesser known agents, such as Don Ignacio, a tiger hunter on the Apure River in Venezuela. (Figure 2)
Switching to Itinera's "Chronology" function, the same dots are flattened into a temporal sequence. Here, the timeline reveals the intensity of Humboldt's movements in 1800 and again in the 1820's and early 1830's. (Figure 3) Choosing another traveler from Humboldt's dense wheel of acquaintances creates an overlapping sequence of differently colored dots on both the "Routes" and the "Chronology" visualizations, revealing where Humboldt and his companions converged in time and space. In large urban contexts such as Paris and Rome, multiple life events from numerous narrative-structured sources convene, offering the potential for new historical discovery. (Figure 4)
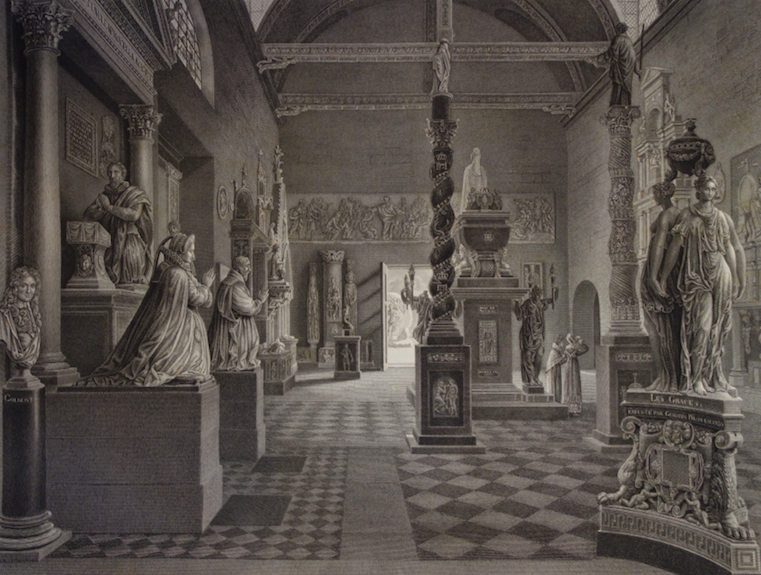
As Project Manager of Itinera, I collaborated on the implementation of a new feature, the object module which adds data about mobile objects, such as scientific collections, monuments, and works of art, to the travelers, routes, and chronology functions. This new module extends Itinera's capabilities to map the mobility and intersection of physical artifacts as well as human endeavors in both space and time. Itinera's agents are continuously moving, creating, and interacting with objects, essentially constructing and deconstructing both communities and collections. Humboldt gathered physical samples, produced books, and created collections of natural objects during his travels. The object module was developed as a way to represent those relationships. Presently, it is complete but still in the early stages of implementation. The Itinera team is currently researching object collections to include in the database. This new module also links effectively to my current dissertation research, which explores the development of French history through a chronology of displaced cultural artifacts at the short-lived Parisian Musée des monuments français, which was open from 1795 to 1816. Its collection was composed of art objects, sculptures, and architectural fragments mobilized due to the nationalization of property during the French Revolution, when artifacts of the church and the aristocracy were gathered into depots and processed for sale, reconstitution, or preservation. At the Petits-Augustins depot, Alexandre Lenoir, the museum’s first director, found an opportunity to shape a collection for public display from displaced artifacts and art objects, a formative moment in the development of museums in France.
Indeed, the reorganization of artifacts into museum collections during the French Revolution extended to human remains, which introduced a unique challenge to Itinera’s data model. When I entered the exhumed body of Henri de La Tour d'Auvergne, Vicomte de Turenne, the French Marshal General under Louis XIV, into the system, I was asked to confront the boundaries of personhood and objecthood in both Itinera and in my own research. Turenne died in 1675 and was buried in the Basilica of Saint-Denis. His body was exhumed in 1793 and taken to Paris, first displayed at the Muséum d'histoire naturelle, then incorporated into the Musée des monuments français, until finally interred at Les Invalides. This object/corpse presented a new set of problems to the recently created objects module. How does objecthood affect agency? Namely, is a deceased body a person or an object? We concluded it was both. The agent Turenne became the creator for the object Turenne at the moment of his death in 1675. New network relationships emerged between the agent Turenne, the object Turenne, and other Itinera agents who interacted with Turenne as a person, an interred body, or a museum object across space and time. (Figure 5)After my tenure as Project Manager on Itinera, I have been continuing my dissertation research on the Musée des monuments français, which, having closed in 1816, only exists today in texts, images, and archives. Lenoir organized the collection of the Musée des monuments français into a sequence of architectural and sculptural experiences. An Introduction Hall presented the origins of French art, followed by five immersive century rooms decorated in the manner of their eras, a sequence of exterior courtyards framed by large architectural fragments transported from Gaillon and Anet, and a picturesque garden, the Jardin Élysée, where monuments mingled with the tombs of selected important figures from French history, including Turenne. After 1816, the museum was dismantled and the objects relocated and reconfigured into new collections.
To organize my thoughts and data on this collection, I began thinking about the systematic way Itinera processes historical information as a methodological research tool for my own work. To create a life event, we must mine a narrative for specific data standardized by Itinera's data model. In the case of my research, thinking more like Itinera helped me to understand that the existing narrative descriptions of the museum were creating imbalanced accounts of its collection: certain objects on display were given prominence, while other features were ignored or barely described, thereby presenting an incomplete record of the holdings. Moreover, the Musée des monuments français was ephemeral, and each object in its collection had a unique history of mobility. I established a standardized set of criteria for each gallery of the museum. Using archival images and texts, I began to identify the origin, age, creator, position in the Musée des monuments français, and contemporary state of every object in the museum. (Figure 6)The outcome of this research was a comprehensive index of all the objects on display at the Musée des monuments français. I potentially identified several lesser-known pieces of the collection, including a Trinity currently held by the Musée nationale de la Renaissance in Écouen, several Gothic bas-reliefs now at the Basilica of Saint-Denis, and the priants of Chréttienne Leclerc and Marie de Bourbon-Vendôme, now conserved at the Musée du Louvre and the Basilica of Saint-Denis. I reconstructed the organization of the hallways, courtyards, and other auxiliary spaces of the museum, giving a more complete impression of the overall museological experience. I traced patterns in the development of the museum and critical distinctions between the treatment of interior and exterior objects that significantly developed my research.
My work using Itinera to study Alexander von Humboldt and Alexandre Lenoir resulted, in both cases, in a unique visualization of a large collection of data. For Alexander von Humbolt, this visualization took the form of an interactive interlace of points on a map and a timeline representing the extent and intensity of major scientific enterprises. The graphic representation of Humboldt’s journey in Itinera offers a dynamic platform for further historical research and collaboration. Examining the Musée des monuments français through the lens of Itinera, the reconstructed physical spaces and mobile relationships recovered from the data revealed new object relationships and a comprehensive view of the development and transformation of the collection. As an apparatus of visual knowledge and a research methodology, Itinera challenges the boundaries of narrative history for a richer, more complex understanding of journeys, social relationships, and object life histories. -
1
media/NewLalande.jpg
media/Montagu.jpg
2017-10-14T06:49:00-07:00
Displacement #2: Itinera as Site
35
Lily Brewer and Meredith North
image_header
2018-02-22T20:55:05-08:00
This displacement represents not only a conversation between Lily Brewer and Meredith North, both past project managers of Itinera, but also a video tour of the project's front-end and back-end interfaces that they both choreographed and produced. The video represents a walk-through of what it takes to create life events for Itinera, including the work of adding a new site when it does not already appear in the geographic hierarchy. The story of working with the data-entry interfaces of the project is told through the travels of Lady Mary Wortley Montagu and her sister, Lady Mar.
This walkthrough is a vivid reminder that "data entry" is not a mechanical process. Transforming the historical record into structured data that can be manipulated and visualized effectively requires not only a great deal of time, but also intellectual, interpretive labor. It is not a simple thing to read, digest, and carefully re-present the information left to us from the past. The ability to think through the consequences of our actions is essential to the process. Critical reflection is key.
As Lily and Meredith discuss in their interactions with Itinera and one another, the visitor is also invited to engage with the text-based annotations that step through the work that is happening on screen, providing guidance and further information about the process of working with Itinera's data.
The system that they use, and that underpins all of Itinera, is called CollectiveAccess, an open-source collections management system designed and supported by a group called Whirl-i-Gig. The Whirl-i-Gig team, including Seth Kaufman and Sophie Byerley, have been critical to Itinera's current design, having been continuous collaborators with the team at Pitt team over the past five years. CollectiveAccess has been chosen as a platform for a number of reasons, but perhaps the most critical is that it not only allows us to effectively model agents, objects, and sites as co-equal actants in a complex system, but it also allows us to describe the qualities and the characteristics of the links between them.
The video will begin playing automatically after a loading, or after clicking the arrow/play button. The annotations will appear automatically once the film begins streaming.