Bar Graph of Conversational Dominance
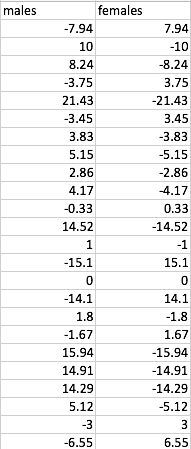
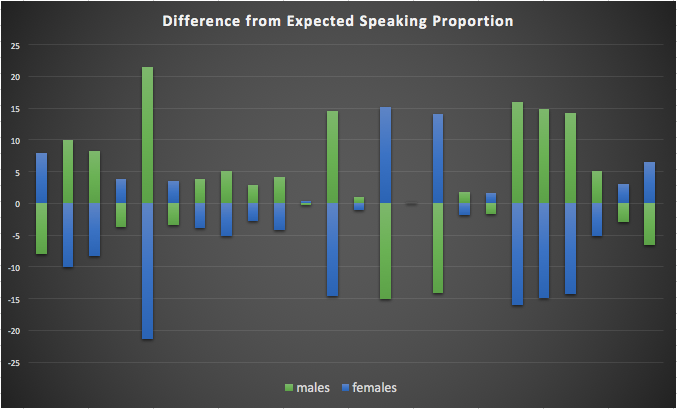
1 2016-12-14T16:12:19-08:00 Madison Rahner 9fd2e99b1239236434d9d5782eb4757f2e5d3243 14119 1 This bar graph shows how much more than their expected proportion each gender spoke in the 24 recorded mixed-sex conversations. plain 2016-12-14T16:12:19-08:00 Madison Rahner 9fd2e99b1239236434d9d5782eb4757f2e5d3243This page is referenced by:
-
1
2016-12-14T07:56:40-08:00
Data
12
A summary of data collected
plain
2016-12-15T09:24:22-08:00
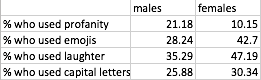
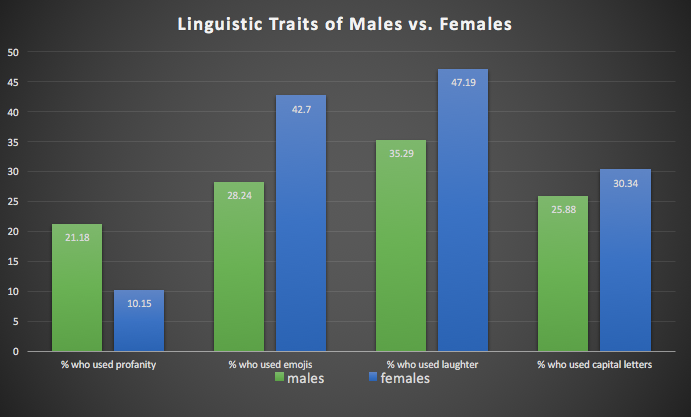
Of the 85 males in this study, I have found that 21.18% of them used profanity, 28.24% of them used emojis, 35.29% of them used laughter representatives, and 25.88% of them used entirely capitalized words. Of the 89 females in this study, I have found that 10.15% of them used profanity, 42.70% of them used emojis, 47.19% of them used laughter representatives, and 30.34% of them used all capital letters. This can also be seen in the data table and bar graph below. This means that 11.03% more males used profanity than females. 14.46% more females used emojis than males. 11.90% more females used laughter representatives than males. 4.46% more females used all capital letters than males.
In looking a which gender tended to dominate conversations most often, I found that in looking at 24 mixed-sex conversations males spoke more. The average difference between the proportion of the conversation they contributed and the proportional number of males in the conversation ([observed proportion] - [expected proportion]) was 2.8%. The maximum amount by which males proportionally dominated the conversation was 21.43%. The maximum amount by which females proportionally dominated conversations was 15.10%. This can be seen in the data table and bar graph below.
Of the 24 mixed-sex conversations observed, 14 of them were male dominated and 9 of them were female dominated and one was proportionally equal. Within the 14 male-dominated conversations, the average percentage of dominance was 8.80%. Within the 9 female-dominated conversations, the average percentage of dominance was 5.83%.
In looking at the bar graph of conversational dominance, it is clear that the fifth, eleventh, thirteenth, fifteenth, eighteenth, nineteenth, and twentieth conversations are significant because they are the ones with the greatest dominance percentages. Respectively the gender ratios (male:female) for this conversations were 1:1, 5:4, 1:1, 1:3, 2:1, 2:1, and 2:1. -
1
2016-12-14T07:57:12-08:00
Analysis
2
What is the meaning of this data?
plain
2016-12-15T07:59:41-08:00
The most interesting results about linguistic features that I found regarded the use of capital letters. I predicted that males would use more capital letters to show aggression and conversational dominance, but what I found was that more females also used capital letters than males by 4.46%. This suggests that rather than using capital letters to represent yelling, they were used to function as an intensifier- like the words “so” or “very” are used more frequently in Habbo Hotel. I don’t think this is the case simply because more females used capital letters than males, but rather because of the context they were used in. When females used capital letters in Habbo Hotel, the most frequently capitalized a single word or a small cluster of words. Examples of this would me “i LOVE you” or “ur hair is SO pretty.” In these instances, the capital letters function similarly to the way italics script does, by adding emphasis and intensity to the chosen word. Males on the other hand more frequently capitalized entire sentences when they spoke, but it wasn’t always in an angry context. For example some would just type lyrics to songs in all caps and submit them in the conversation. I interpreted this more as a means of taking up conversational space, drawing attention to oneself, and attempting to exert conversational dominance.
All of my other predictions regarding linguistic features were correct however. I predicts that females would use more emojis and laughter representatives than males would and I predicted that males would use more profanity. Both of these were correct. I found that 14.46% more females used emojis than males, 11.90% more females used laughter representatives than males, and 11.03% more males used profanity than females. These finding suggest that many of the gendered linguistic stereotypes that function in real life and in adult conversations are persistent not only into computer mediated communication, but also into the conversations of adolescents and young adults.
In looking at conversational dominance in mixed sex conversations, I was a little surprised by my findings. I expected that males would dominate females in the conversations, and that's what my findings suggest as well, but not to the extent that I expected. According to my data, on average males dominated mixed sex conversation by 2.80%. I expected this margin to be much higher based on the degree that males tend to exert dominance in real life conversation. Of course, males did dominate to a high margin in several instances, by as much as 21.43% in some cases, but females also did it in some instances (by as much as 15.10% in the most extreme cases) which averaged it out to the non remarkable average of 2.80% male dominance.
It’s worth noting that the male to female ratios in each mixed sex conversation varied regularly which certainly impacted conversational dominance to some degree, even when you look at it proportionally as I have done. For example some conversations had 1:1 ratios like the fifth conversation which was dominated by males by 21.43% and other conversation like the fifteenth one have 3 females and 1 male and was dominated by females by 15.10%. An example of a mostly male conversation is the eleventh one, which have 5 males and 4 females and resulted in a slight female dominance of 0.33%. Because of the significant number of variables that go into conversational dominance, I think that it would be worth gathering more samples before making any drastic conclusions regarding conversational dominance on Habbo Hotel.