Section 3: Business Model Mapping / FINDINGS
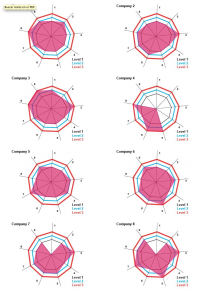
Figure 27 - Business Model Mapping
Mapping Visualization *Total count of 8 companies
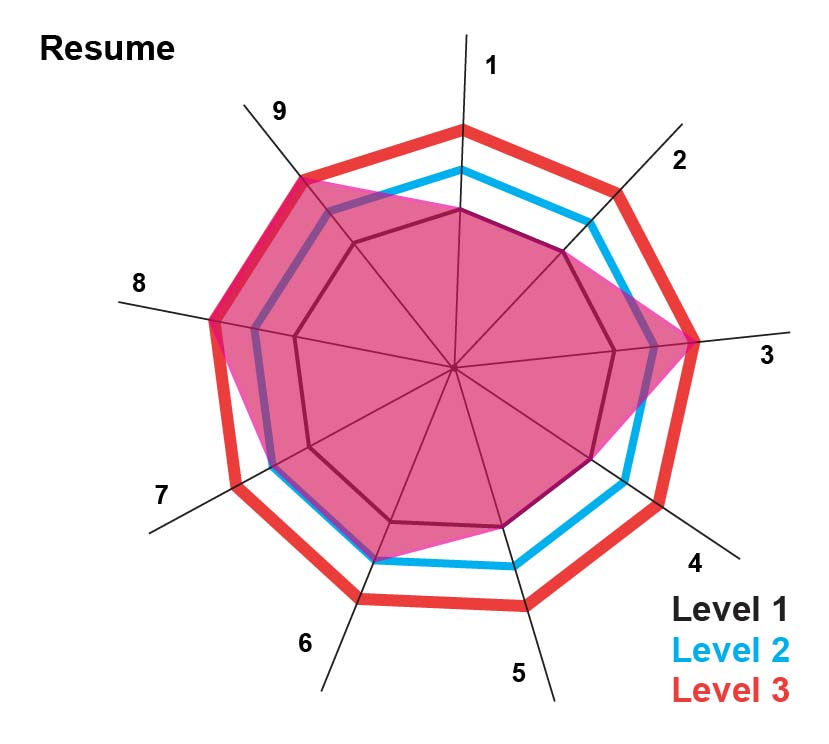
An average count of each component shows an initial small investment for component nº1; a small customer base for component nº2; integration of the analysis of feedback received from clients for component nº3; low level of networkedness with no participation in international networks, showing affiliation to one or three business organizations hubs or networks locally for component nº4; high level of variation between companies, showing diversity of approaches to distribution and complexity channels, capabilities and revenue models for component nº5, nº6 and nº8; differentiation as the most frequently used strategy followed by customer care for component nº7, in terms of component nº 9 the average take is to invest money early in network activities considering this expenditure as part of their regular expenditure.
Figure 28 - Average Business Model Mapping
Average Mapping Visualization *Total count of 8 companies
According to the small sample of companies interviewed the approach take to develop the company is organic growth. Only two companies express their will to consider selling the company to a big organization and also, two companies are thinking to work collaboratively with other organizations to improve or explore new revenue models. There is some evidence to suggest that companies in the digital cluster need support in internationalization and scalability challenges and the inflow of exposure to users and new markets out of Hull City influence area.
Startup Average Ratios Digital Economy Hull
Duedil public data *Total count of 53 companies
Trade debtors: 25235
Net Assets: 35
Debt to Capital: 250%
Liquidity Ratio: 2