Thanks for your patience during our recent outage at scalar.usc.edu. While Scalar content is loading normally now, saving is still slow, and Scalar's 'additional metadata' features have been disabled, which may interfere with features like timelines and maps that depend on metadata. This also means that saving a page or media item will remove its additional metadata. If this occurs, you can use the 'All versions' link at the bottom of the page to restore the earlier version. We are continuing to troubleshoot, and will provide further updates as needed. Note that this only affects Scalar projects at scalar.usc.edu, and not those hosted elsewhere.
FROM INCUBATORS TO ECOSYSTEMS: EVALUATING THE STARTUP DIGITAL ECONOMY CLUSTER OF HULL CITY Main MenuABSTRACTAbstractLITERATURE REVIEWReview of relevant and recent literature on /Digital Economy/ Complexity Theory/ Social Media and Network Theory/ Business Model ResearchMETHODOLOGYResearch stages and methods for the case study are summarised as followsFINDINGSLinksANALYSISLinksDISCUSSIONLinksCONCLUSIONSBIBLIOGRAPHYauthors in alphabetical orderAcknowledgementsAcknowledgementsJosep Almirall3aa606bbf169519dce4053897d289d9b58670ab0Author: Josep Almirall (January 2016 - December 2016)
Section 2: Network Analysis / ANALYSIS
12017-01-21T15:31:30-08:00Josep Almirall3aa606bbf169519dce4053897d289d9b58670ab01456513Methods and analysis SECTION 2 (Network Analysis): Social Media Analysis + Strong Connectivity (most connected) + Content analysis + Likes per countryplain2017-03-23T14:33:31-07:00Josep Almirall3aa606bbf169519dce4053897d289d9b58670ab0
Methods and analysis
Social Media Analysis
Strong Connectivity (most connected)
Content analysis
Likes per country
The second part of the analysis corresponds to the social media and network observations for the two selected hubs and analysis of the global presence of the totally of companies with facebook pages using data containing information on likes per country of each Facebook page, to download this data I used the Netvizz Facebook app. Firsts results after checking for the online presence of all indexed companies after data validation show that there is not a prevalent use of social media platforms (38% of companies with Facebook pages and 45% of companies with Twitter accounts) and that there is a symbolic global representation of interaction points outside the UK.
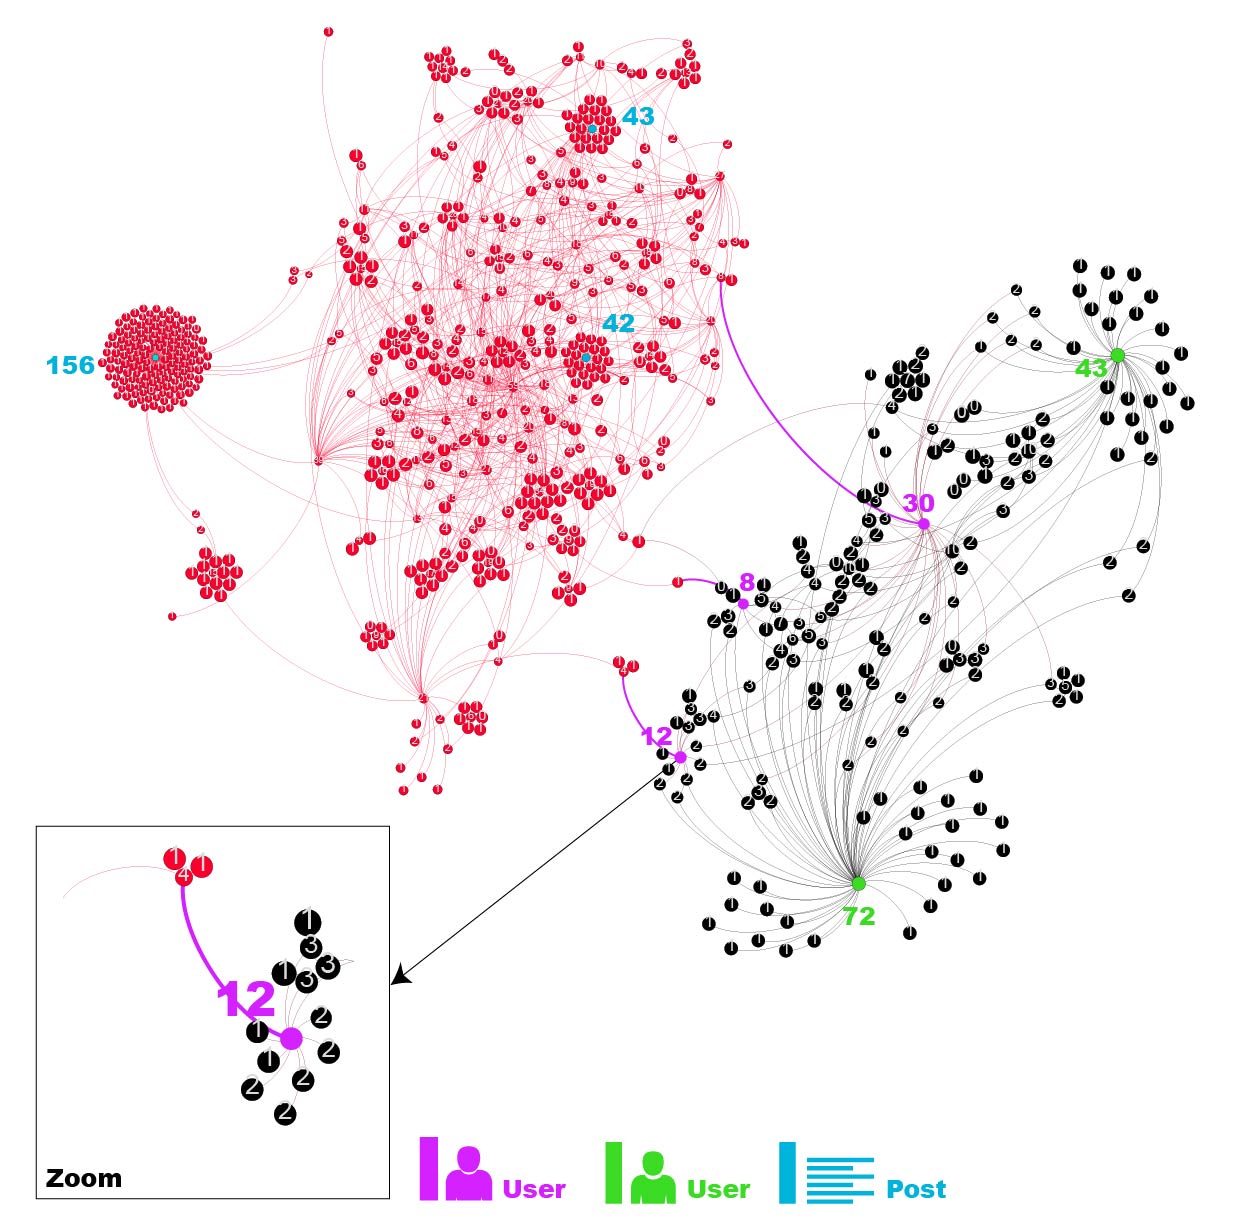
The combination of data from posts by page and users downloaded from the C4DI Facebook page (in red) and The Enterprise Centre Facebook pages (in black) using Netvizz and imported into Gephi as append graphs show the centrality of the C4DI network after applying Force Atlas 2 layout. Other calculations of strongest connectivity applied to the node size help visualize the most connected items in order to perform first interaction analysis and afterward content analysis. Figure 29 show labels representing the count per like of each central node, this indicator has been used to located via data laboratory in Gephi the central node in order to perform content analysis and identify emergent patterns among the most connected items, such as that while C4D1 has a strongly connected network with an even distribution of users and posts the graph also shows evidence that point out The Enterprise Centre network as a superuser network with a fewer connectivity among posts.
Figure 29 - Representation of strongly connected components
Facebook network *C4DI & Enterprise Centre facebook pages
GRAPH COMPONENTS INFO
Nodes: 871
Edges 1344
Directed Graph
Combination of data from posts by page and users downloaded from C4DI (red) + Enterprise center (black) facebook pages using Netvizz and imported into gephi as append graphs
Data Timeframe 2010/08/28 - 2016/09/03
Data: Likes per post/user
INTERVENTIONS
Node size represents strongly connected id
Lavel show like count of central nodes
Layout: Force atlas 2 + Yifan Hu
Filtered peripheric nodes (not connected, with no links)
STATS
Average degree 3.086
Network Diameter 1
Modularity 0,619
Connected Components 104
Average path length 1
This page has paths:
12017-01-21T15:28:36-08:00Josep Almirall3aa606bbf169519dce4053897d289d9b58670ab0Section 2: Network Analysis / FINDINGSJosep Almirall17List of findings from Network Analysisplain2017-03-23T14:30:16-07:00Josep Almirall3aa606bbf169519dce4053897d289d9b58670ab0