Data and the Humanities
Sample Project
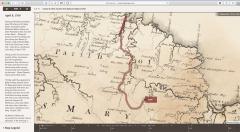
Navigate to Slave Revolt in Jamaica, 1760-61. For more information about this project, see Vincent Brown, "Mapping a Slave Revolt: Visualizaing Spatial History through the Archives of Slavery," Social Text 125 (December 2015): 134-141.
Click on "View the Map" in the upper left corner. Run the animation. Consider the following questions.
- What kind of data does the project draw on?
- How was that data organized and structured to become legible through an interactive map?
- What kinds of questions does this project inspire?
- How can the researcher (who might come from any field) use this project?
Data Driven Methods
This session explores the process of data visualization through five key steps:- Data Discovery
- Data Structuring
- Data Cleaning
- Spatialization and Geo-coding
- Data Visualization
Sample Dataset
salem_GC.csv (download)Derived from the Salem Witch Database
Geocoding Tools
- Latlong.net
- Batch Geocoder for Journalists
- Getty Thesaurus for Geographic Names
- Geocode by Awesome Table (free add-on through Google Sheets)
Public Presentation on Tableau Public
Star Wars Sentiment Analysis by Adam McGann on Tableau PublicDepartment of Art History Visualizations by Nancy Um on Tableau Public
Challenge Dataset
olympics.csv (download)Further Study and Training
- Lincoln Mullen, "Working with Spatial Data," Spatial Humanities Workshops.
- Doing Digital Scholarship, SSRC labs, self-guided tutorials
- Programming Historian Lessons (in English, Spanish, and French)