Data and the Humanities
Sample Project
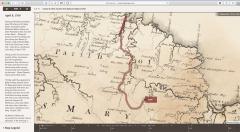
Navigate to Slave Revolt in Jamaica, 1760-61. For more information about this project, see Vincent Brown, "Mapping a Slave Revolt: Visualizaing Spatial History through the Archives of Slavery," Social Text 125 (December 2015): 134-141.
Click on "View the Map" in the upper left corner. Run the animation. Consider the following questions.
- What kind of data does the project draw on?
- How was that data organized and structured to become legible through an interactive map?
- What kinds of questions does this project inspire?
- How can the researcher (who might come from any field) use this project?
This session explores the process of data visualization through five key steps:
- Data Discovery
- Data Structuring
- Data Cleaning
- Spatialization and Geo-coding
- Data Visualization
salem_GC.csv (download)
Derived from the Salem Witch Database
Geocoding Tools
- Latlong.net
- Batch Geocoder for Journalists
- Getty Thesaurus for Geographic Names
- Geocode by Awesome Table (free add-on through Google Sheets)
Star Wars Sentiment Analysis
Challenge Dataset
olympics.csv (download)
Further Study and Training
- Doing Digital Scholarship, SSRC labs, self-guided tutorials
- Programming Historian Lessons (in English, Spanish, and French)