Map functionality
The user can also toggle display options on the map to see different contextual information for the entire map.
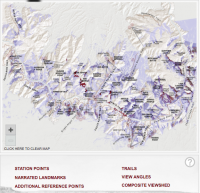
The Station Points, Narrated Landmarks, Additional Reference Points, Trails, View Angles, and Composite Viewshed links toggle on/off transparent PNGs that layer atop the base map. Toggling and hovering powered by custom-written JavaScript. Layers can be viewed one by one or multiple at a time. The map is zoomable, i.e., the map image and its layers can be enlarged for better readability.
When the Composite Viewshed is toggled on, dark purple areas are clickable through an image map (an HTML feature that makes different parts of a single image clickable). When an area is clicked, animated arrows slide toward the area from the locations where other photographs were taken (Station Points). This animation is powered by the Raphaël JavaScript library.
Similarly, when Narrated Landmarks are toggled on, landmark names (text in an image) are clickable through an image map. When an area is clicked, animated arrows slide toward the area from the locations where other photographs were taken (Station Points).
When Station Points are toggled on, numbered circles appear on the map. When the user clicks on a Station Point, the corresponding photograph in the slide navigation (at the top of the page) is highlighted, so an interested user can click on the slide.
Map term glossary, taken directly from the help icon on the website:
- Station Points: Peabody's standing location for each photograph
- Narrated Landmarks: Click on these to access essays about the landmarks
- Trails: Click on select trails to access essays
- View Angles: Depicts heading and L&R edges of each photo
- Crimson Viewsheds: Cartographic rendering of territory visible in a single photograph
- Composite Viewshed: All viewsheds turned on at once. Darker purple indicates a higher number of appearances that area made in the slideshow