Some Ways to Use Outlook Email Data in NVivo
By Shalin Hai-Jew, Kansas State University
The information in work-based (and other) emails can be revelatory for research. For example, a social network analysis can show who is talking to whom, and when. A computational text-based content analysis enables an understanding of various personalities (such as through psychometrics) and their respective interrelationships, when particular knowledge was acquired and by whom, how information was shared, organizational structures and power relationships, and other insights.
Some may remember a web-based affordance from “Immersion” that mapped one’s Google Mail connections. Immersion analysis from email data is still available from the program off of GitHub
even though the original MIT project is no longer supported.
There is apparently another technology, OpenTeams that enables insights on team interactions through digital means.
One well known example of an email dataset that went public comes from a formal investigation during the Enron scandal (2001). The studied dataset is publicly available from the Web. This dataset has been a foundational one for study in computer science and other fields.
Exploring MS Outlook Email Data in NVivo
NVivo, a qualitative data analysis tool, enables the integration of data from the MS Outlook email system for various types of analyses.
For this article, emails from April 6 – 16, 2020, were captured. While some suggest moving emails into other folders for data cleaning, this was not done per se. First, the amount of emails were a little fewer than 200. Also, the data visualizations are set at a level that textual information will pixelate, so nothing is directly revealed. Most of the data representations are summary data ones. And there is nothing sensitive per se if these were revealed.
For this, the Outlook app (not webmail) was opened, and an NVivo project file was opened, and I merely highlighted the emails of interest and dragged them over in several batches into the Files area. The importation of the files into NVivo turned them into .pdf files. (This is not to say that there wasn’t drama earlier trying other methods of capturing information from Outlook for this project. For more, please see the sidebar below.)
About Relationships Made through Intercommunications
For the social networking aspect, one has to highlight all the .pdf files and change them into case files. (Figure 1)
Figure 1: Creating Imported Email .pdfs as Case Nodes
Case nodes are individual “entities” and in the Relationships space in the left navigation, the respective “to” and “from” entities are pulled out as individuals. (Figure 2) The thick lines of part of the ring lattice graph shows an individual who sends out a lot of one-to-many emails to notify an office of various issues of professional interest.
Figure 2: A Ring Lattice Graph of “Relationships” from Exchanged Emails Between Individuals
Finally, it is possible to map social networks from the emails, with cliques and clusters…and motifs…and isolates. (Figure 3) Do note that this is only the networking for a week-and-a-half. Again, the visuals are purposefully pixelated because what is relevant is the concept not the details. To achieve this, go to the Explore tab, and go to Network Sociogram in the Social Network Analysis area.
Figure 3: Social Networks, Cliques and Clusters, Motifs and Isolates from 1.5 Weeks of Emails in Early April 2020
About Informational Contents
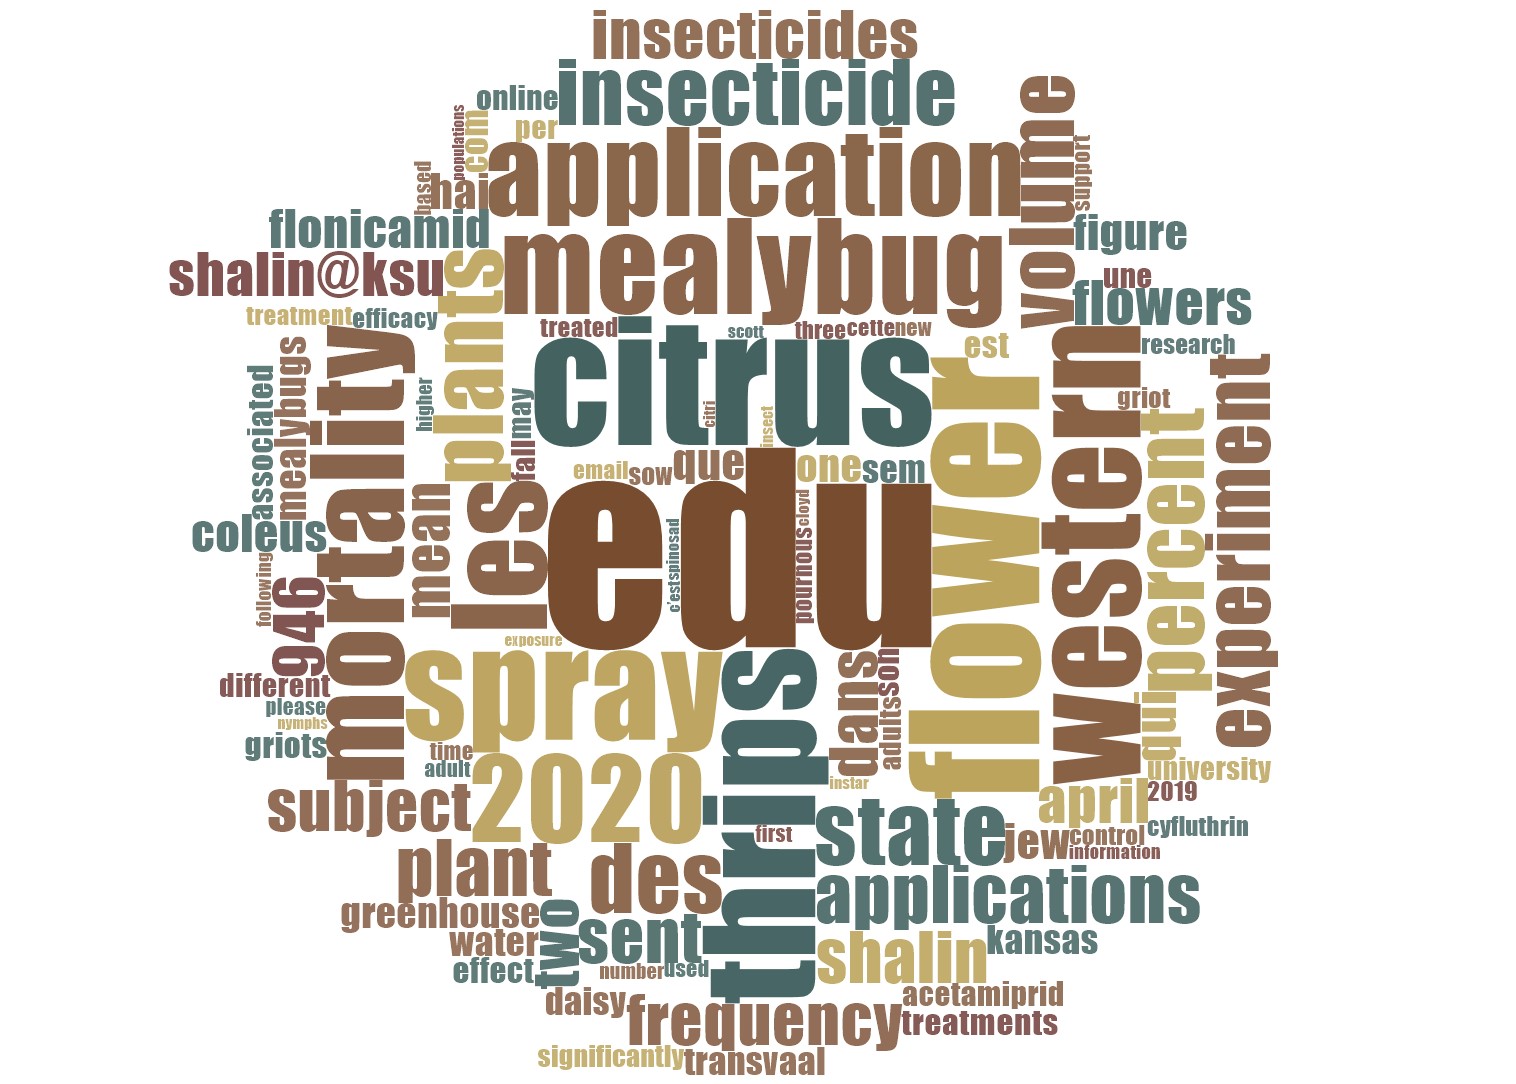
Another approach involves exploring the emails for contents. A simple data query may involve a simple word frequency count expressed as a word cloud. (Figure 4)
Figure 4: A Word Cloud from a Word Frequency Count from the Email Contents / Messaging
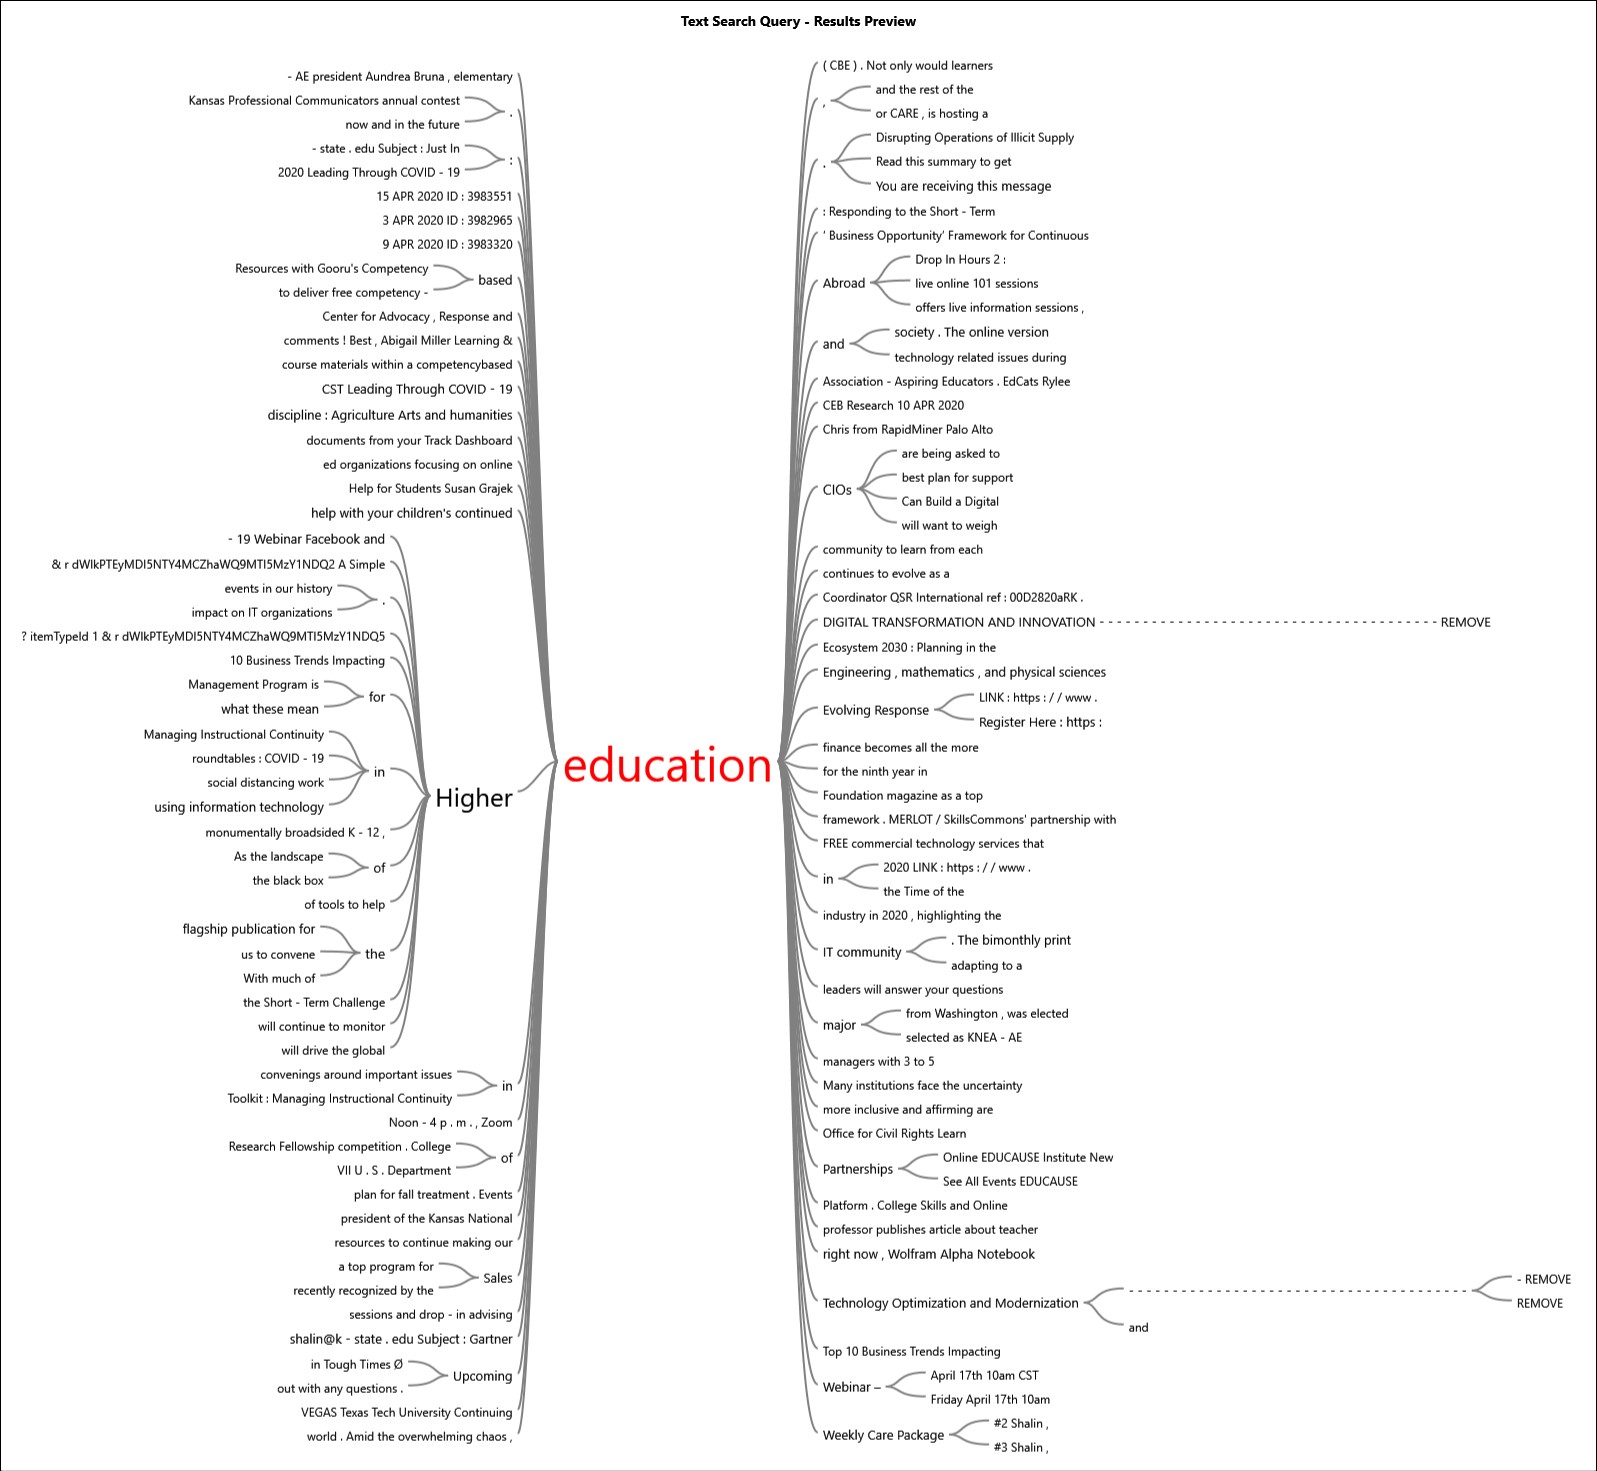
A more targeted query may be a search for particular terms of interest. (These may be names, equations, phrases, and others, defined using Special characters (wildcard characters, Boolean terms, proximity script, fuzzy searches, and other designations). Here, “education” was used as a search term. (Figure 5)
Figure 5: An “Education” Word Tree from the Email Messages
The lead-up words and the lead-away words in the word tree may be seen here.
Autocoded Theme Extraction / Topic Modeling
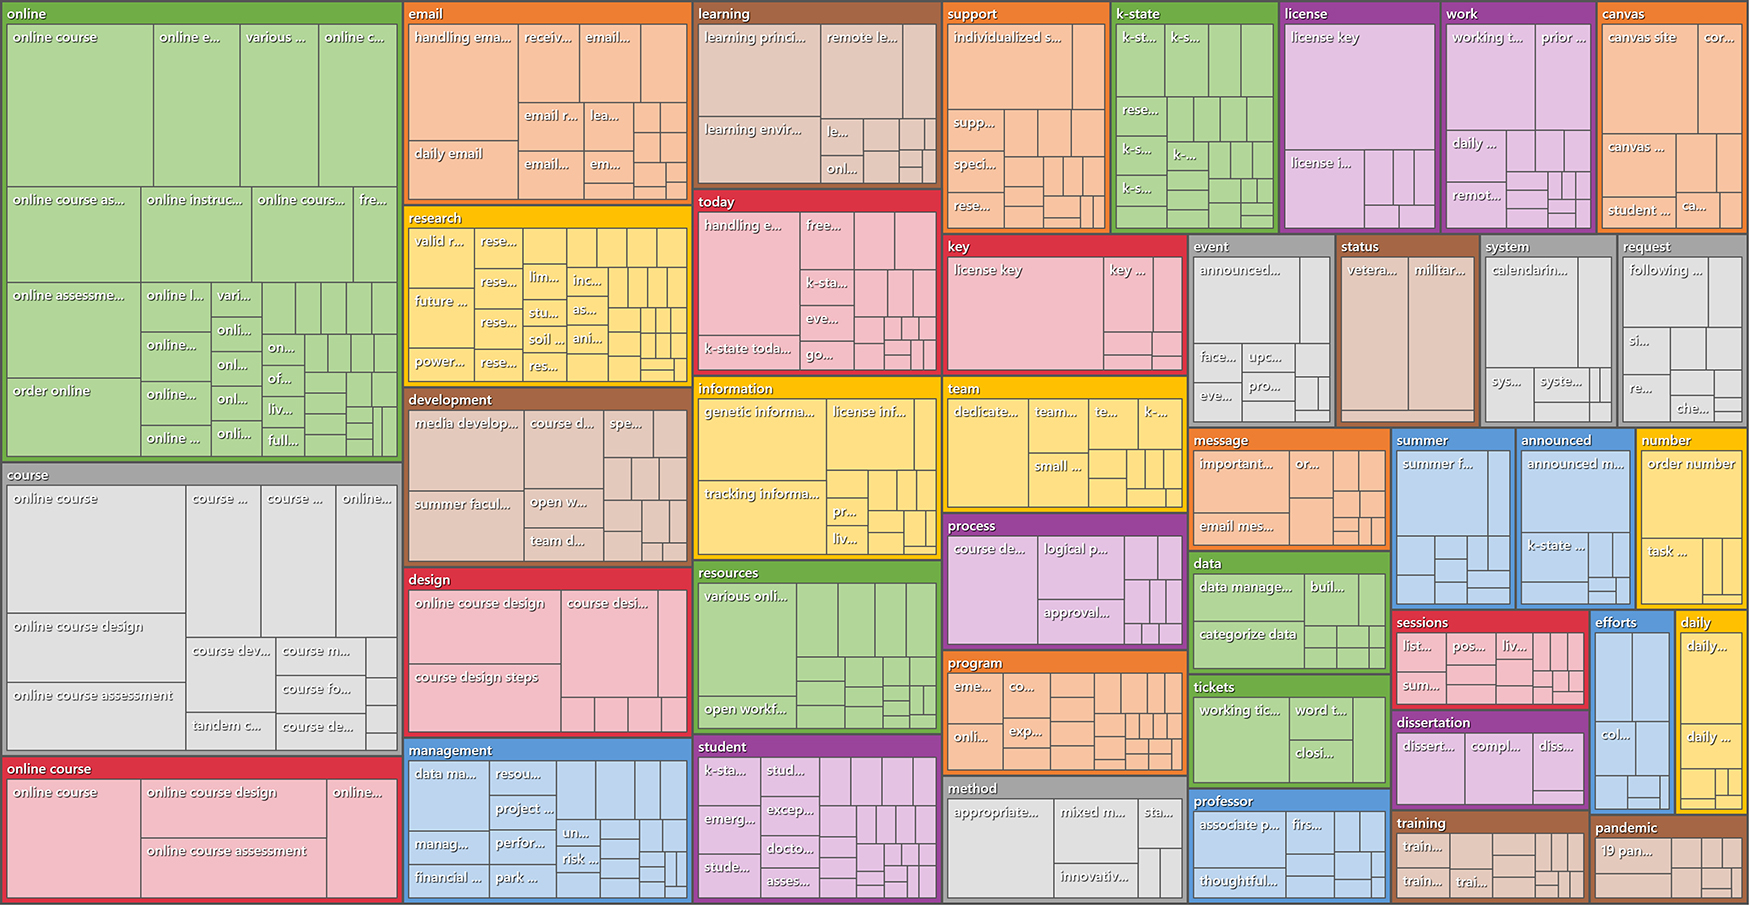
The email set was also run through the theme extraction feature in the autocoding / machine learning module. For the top-level topics, all were accepted except for one last name (“personally identifiable information” or “PII”). [This process as a “human in the loop,” so the human researcher can select out any top-level topic or sub-topic.] The topics were coded at the sentence (vs. paragraph) level of granularity. The results may be seen in Figures 6 and 7.)
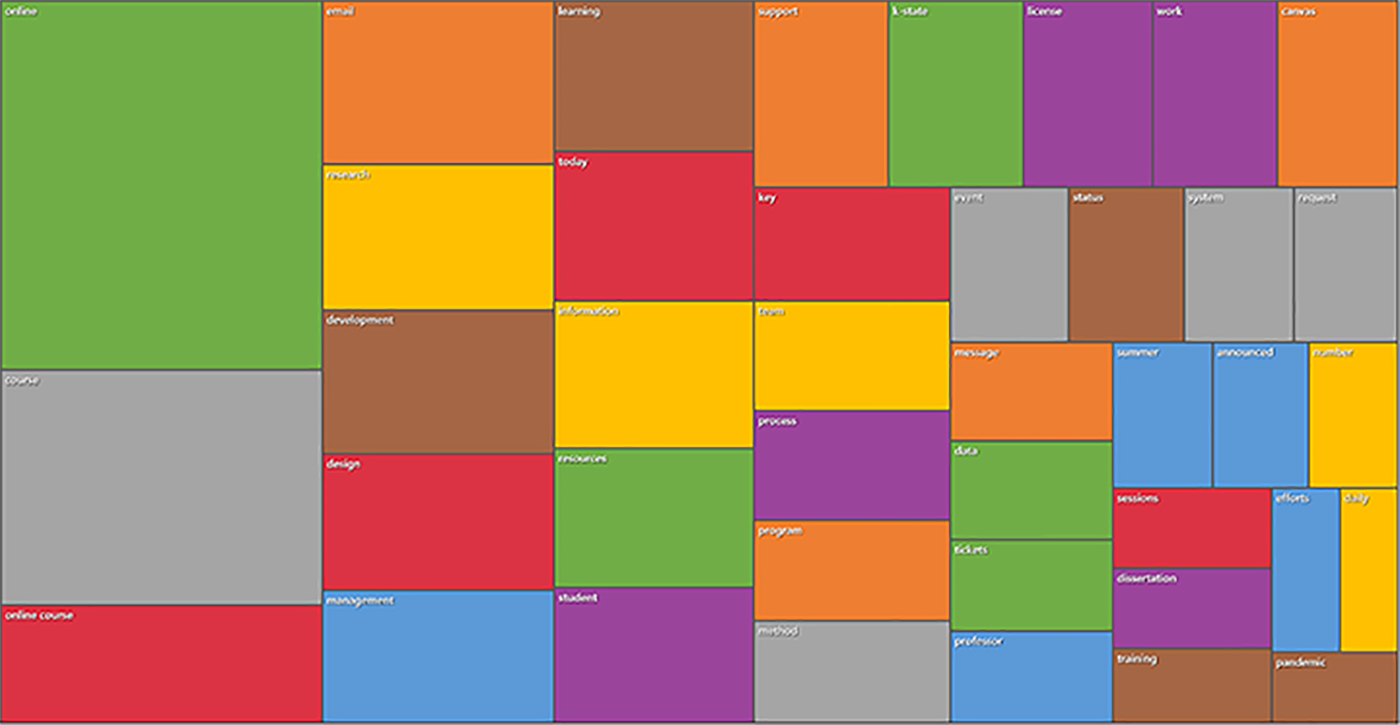
Figure 6: Autocoded Top-Level Topics and Related Subtopics from the Email Set (a treemap diagram)
Figure 7: Autocoded Top-Level Topics from the Email Set (a treemap diagram)
About Sentiment
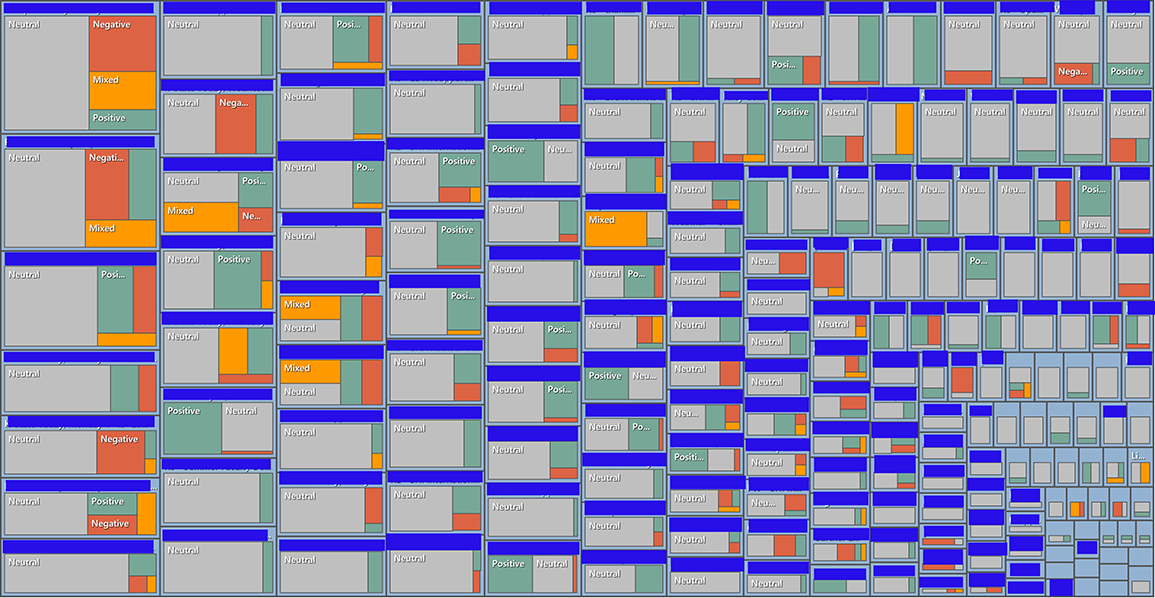
Auto-extracted sentiment of the email bodies show that a majority of the text tends toward neutrality (gray); however, where there is sentiment weight (positive or negative), some are more predominantly negative (dark orange) and others more positive (light green) and some mixed (light orange). (Figure 8) The topics of the respective emails have been redacted in blue here.
Figure 8: Email-by-Email Sentiment Analysis via Autocoding
Clustering by Word Similarity
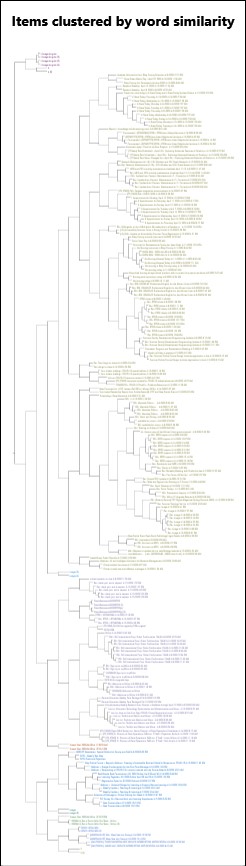
Another approach is to cluster messaging by word similarity, to understand how ideas are connected…and to understand who is in on particular conversations. (Figure 9) Such a horizontal dendrogram is read from the leaves through the branches and to the trunk (and to the roots). The image, of course, is rendered to have the text pixelated because this represents the concept only, without unnecessary details. This analysis is achieved by highlighting the emails, going to the Explore tab, and conducting the Cluster Analysis.
Figure 9: “Items clustered by word similarity” (in a horizontal dendrogram)
The structured data of a dendrogram can be shown as a 3d cluster diagram, a 2d cluster diagram, a vertical dendrogram, a table, or a ring lattice graph, among others.
Outside NVivo
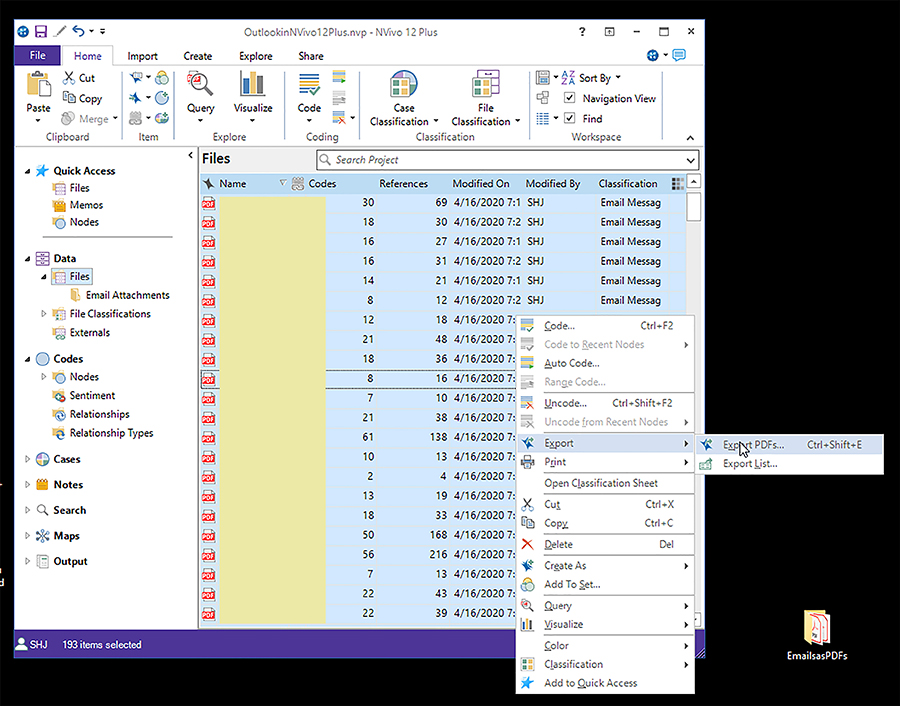
Other tools besides NVivo may be used to analyze the emails (as stand-alone objects or as sets). It is simple to export the files from NVivo into a folder. Just highlight the emails in the Data area, right click, and export as PDFs. (Figure 10)
Figure 10: Exporting the Outlook Emails (pdf files) from NVivo for Analyses in Other Tools
Sidebar: Some Failed Attempts to Export Outlook Email Data for Analysis
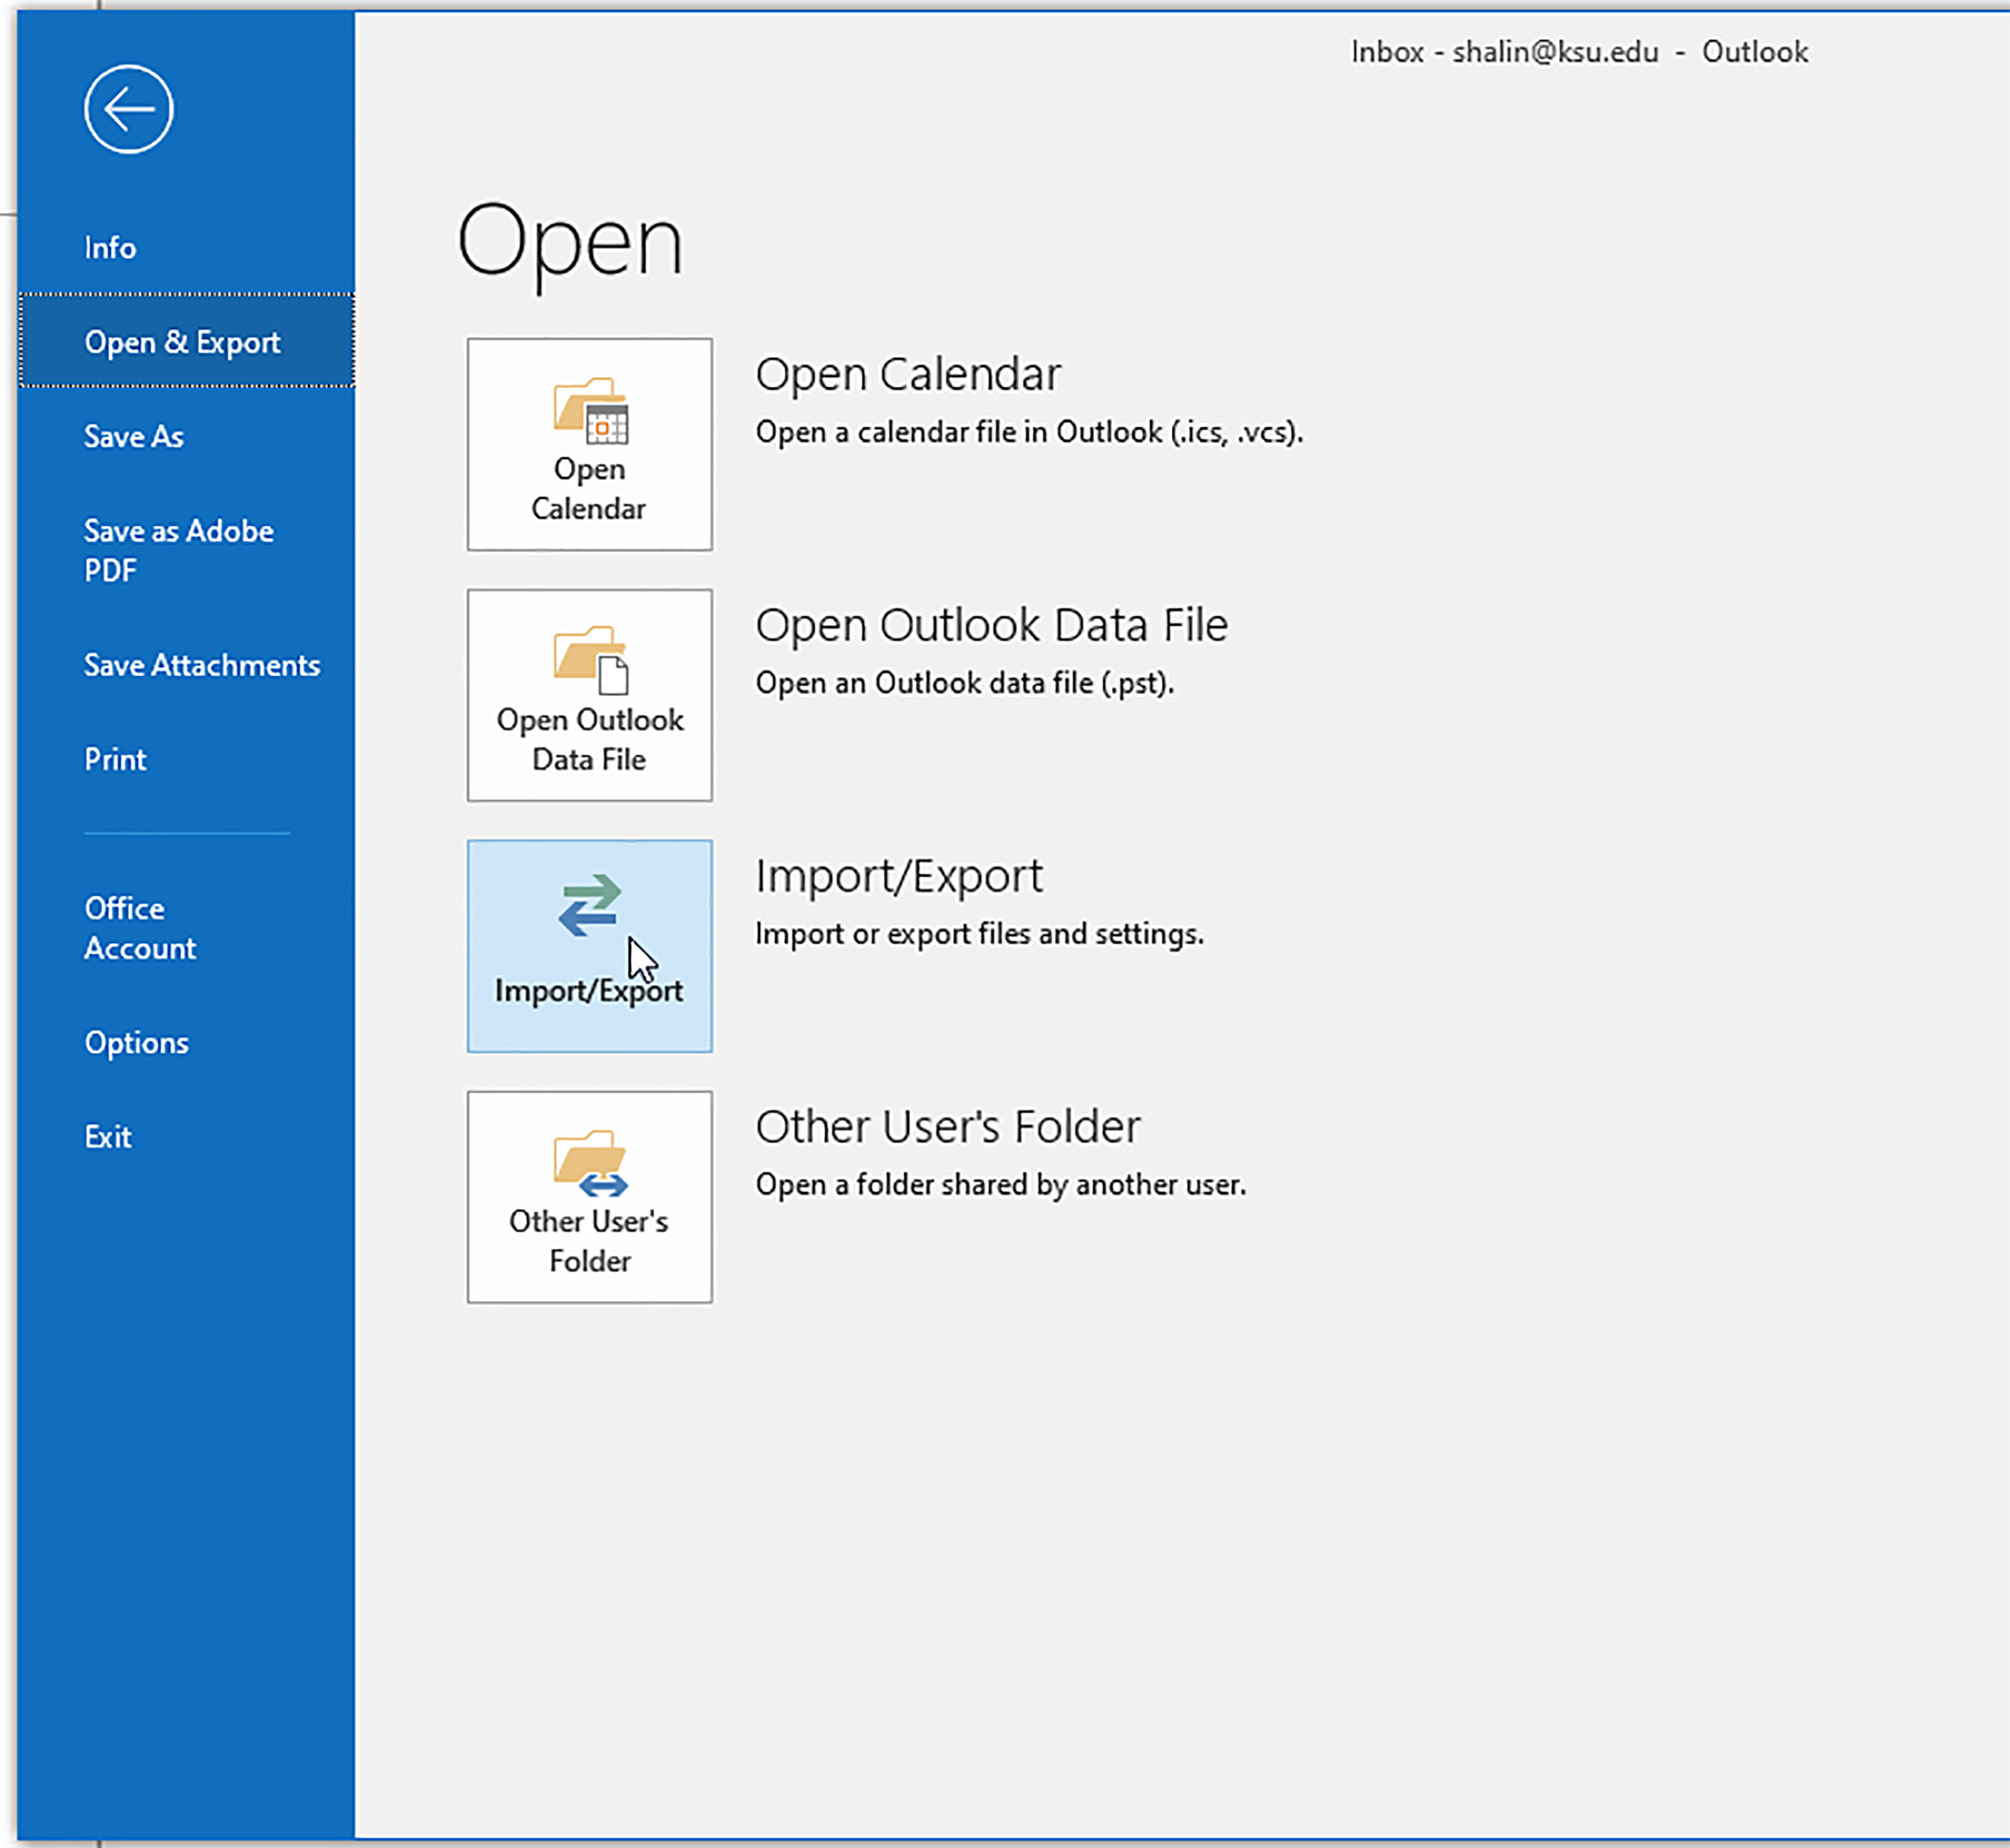
This is not to say that there weren’t some challenges in trying to acquire the email data en masse initially. I tried the basic path of Open & Export…and did get several different file types downloaded: .pst (which requires some sort of transcoder or converter to change to .msg files) and a .csv (in separate runs of the data). (Figures 11 – 18)
Figure 11: “Open & Export” Selection in the Left Menu under File
Figure 12: Export to a File
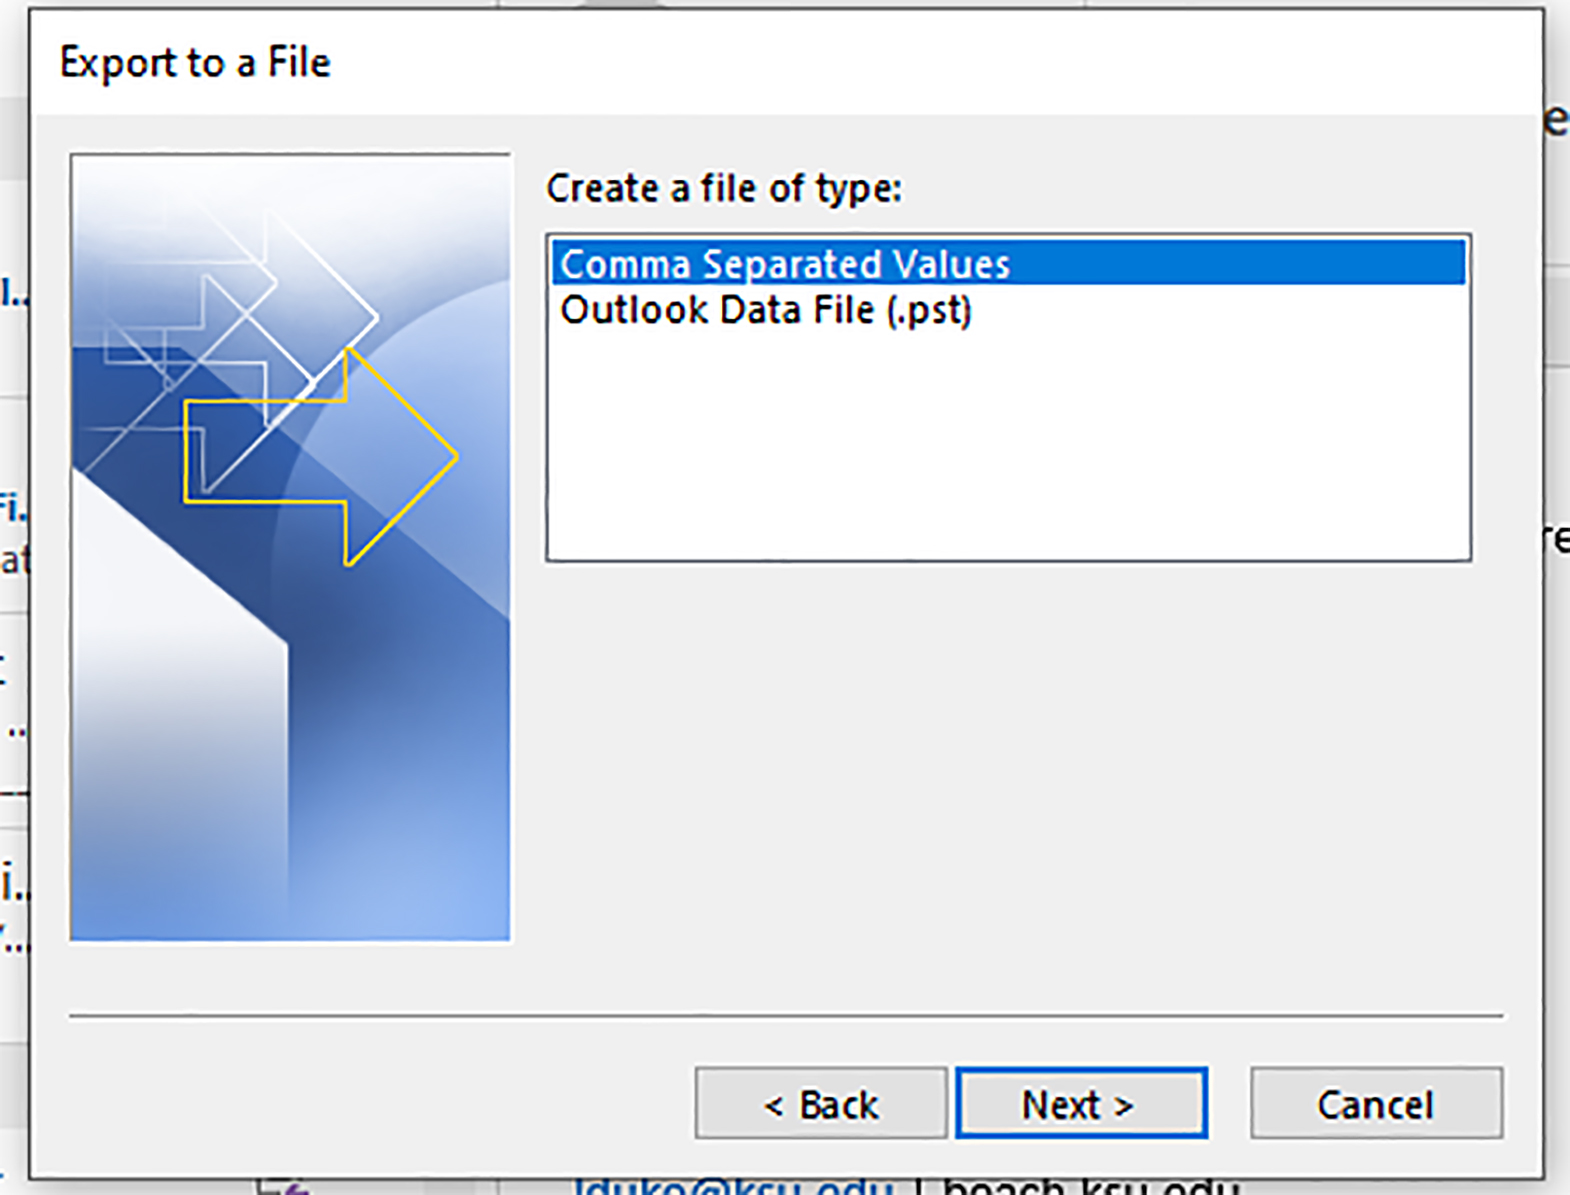
Figure 13: Exporting as Comma Separated Values (CSVs)
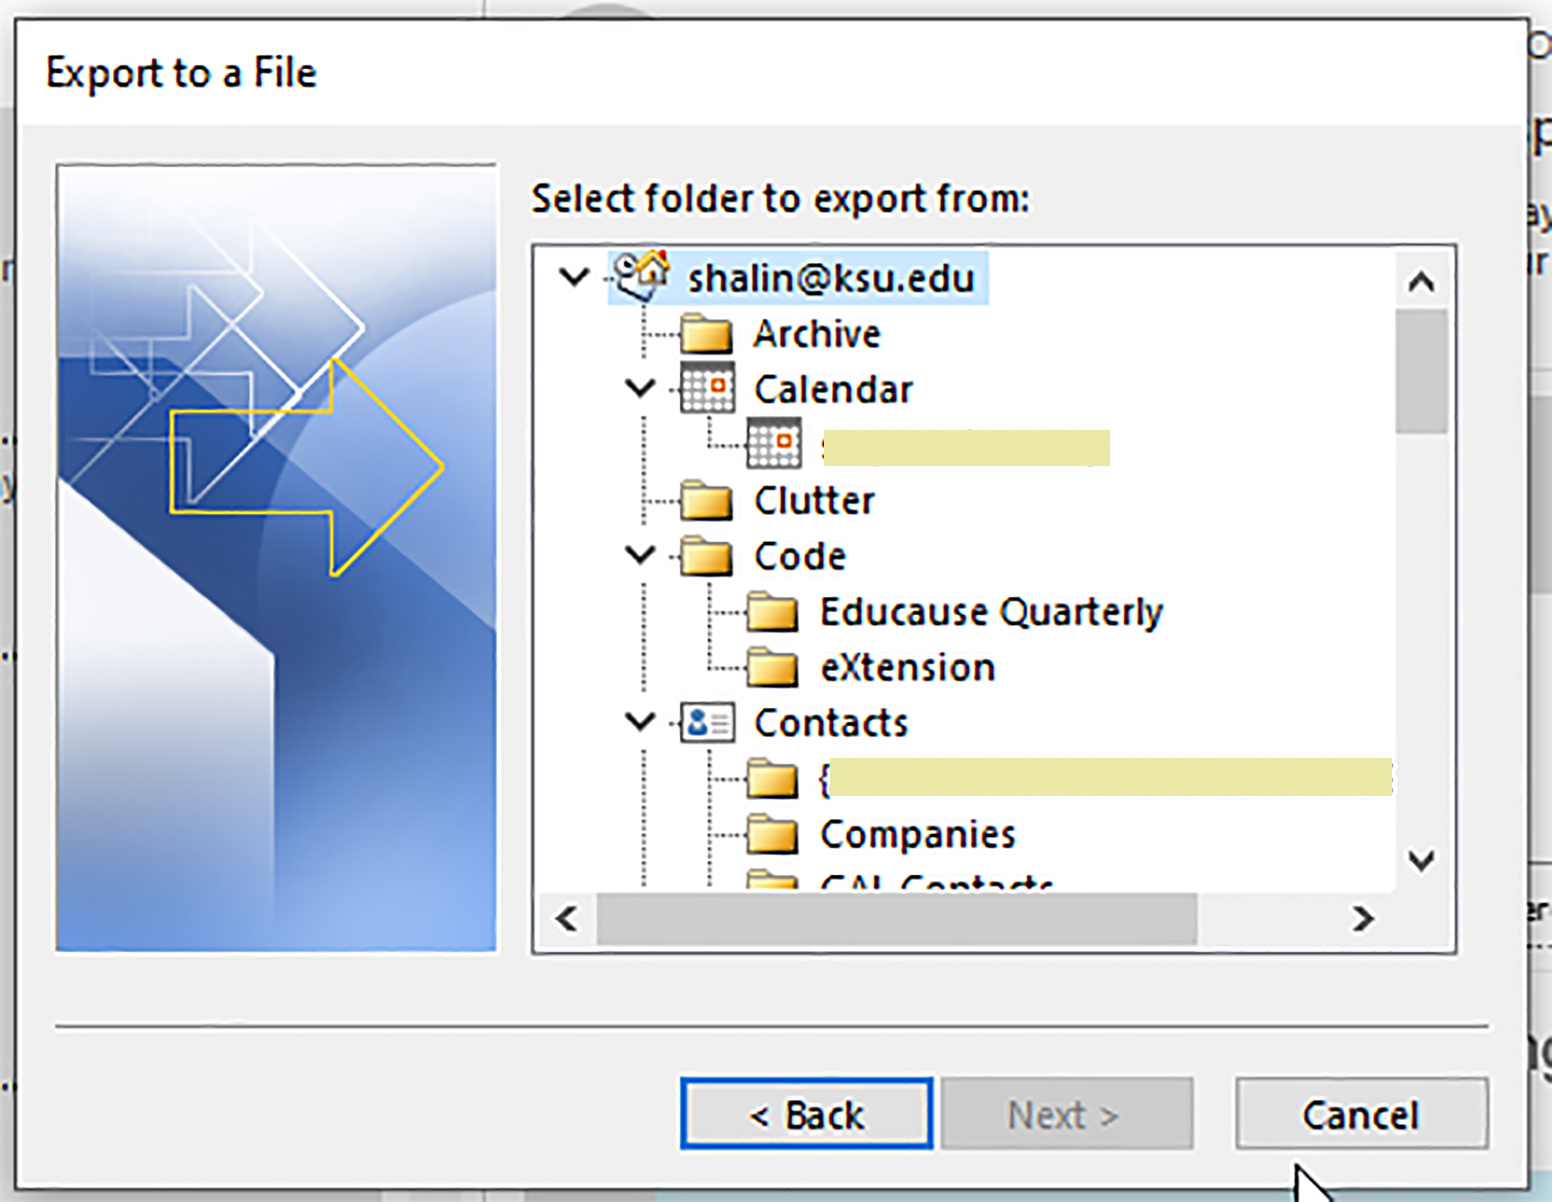
Figure 14: Select Email Account Folder to Export From
Initially, I just exported from the inbox. Then, I realized you could try for everything at the top level.
Figure 15: Top Level (in the Email Account) to Export From
Figure 16: Save File As … in the Documents Area
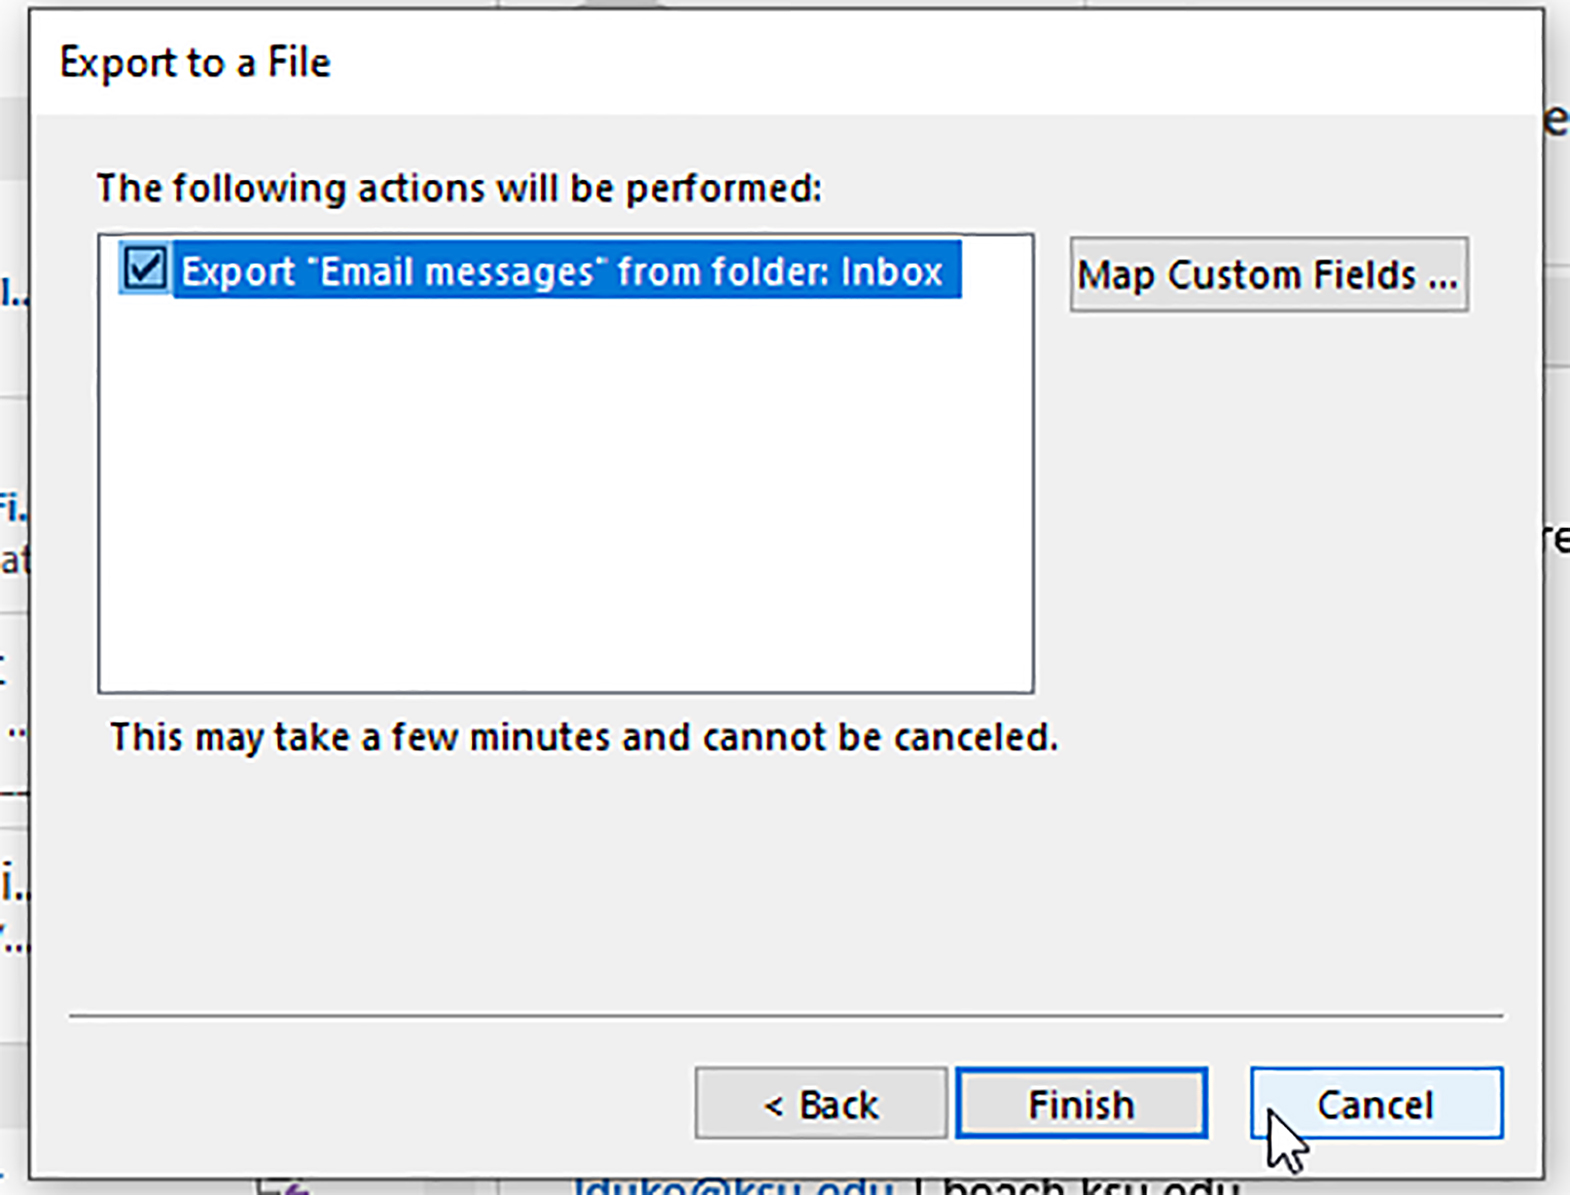
Figure 17: A Final Check before Clicking “Finish”
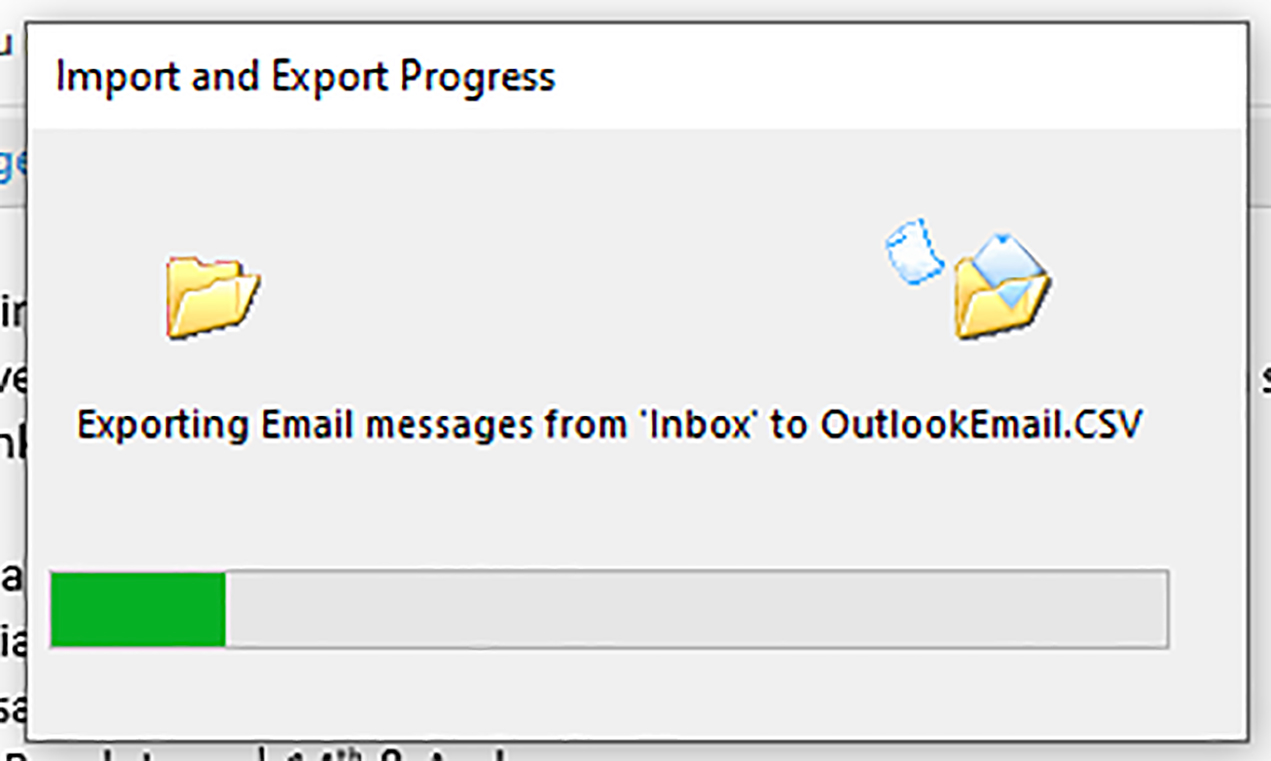
Figure 18: The Progress/Status Bar Window Showing the Export Progress
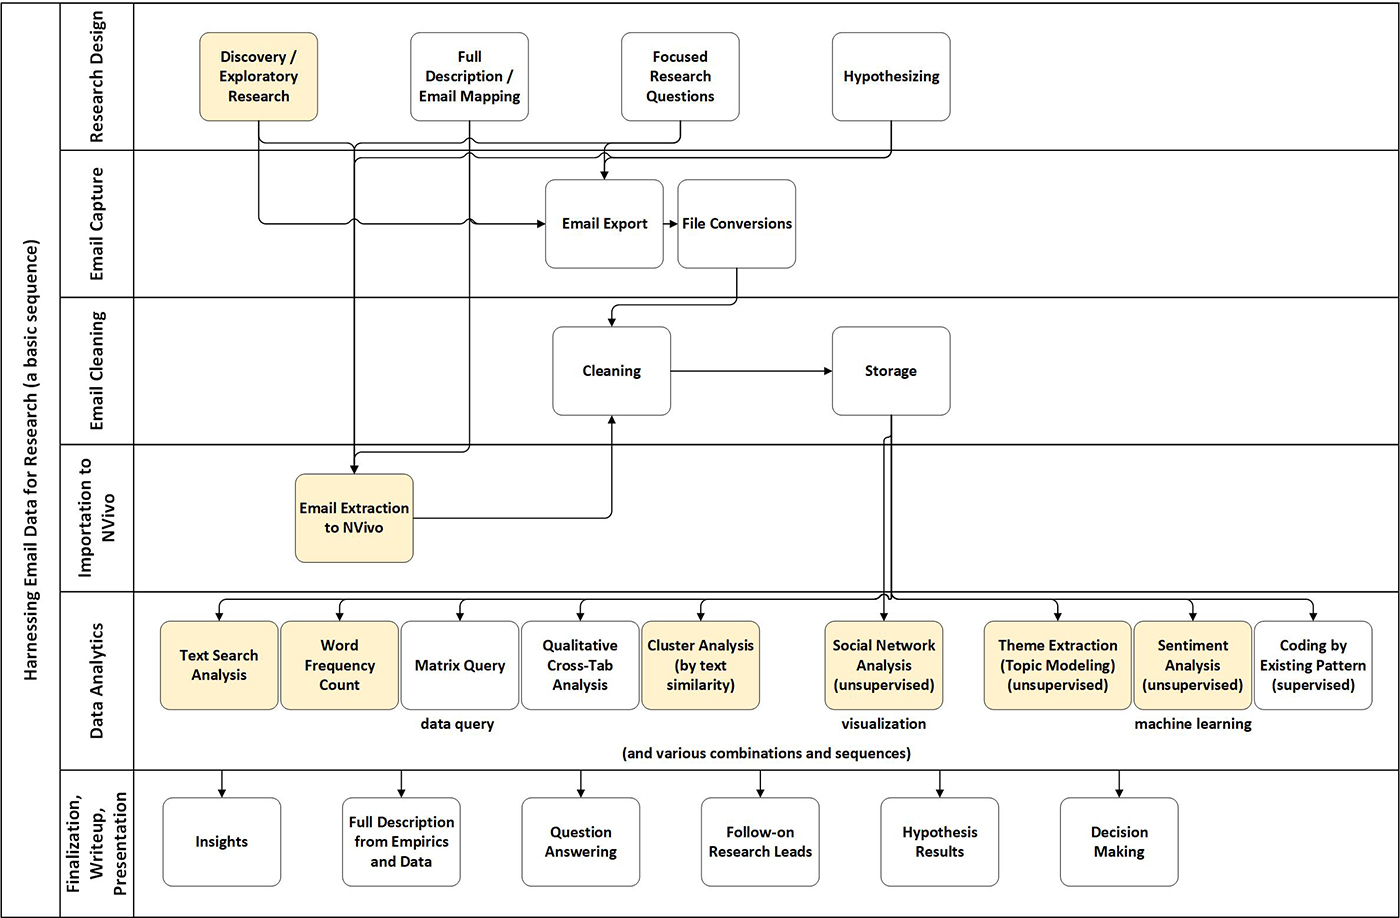
The sequence shown in this work may be seen in Figure 19. The highlighted tasks are the ones achieved in this article. For serious research, there would clearly be much more setup work (review of the literature) and in-depth analysis. For an article, though, this suffices as a light walk-through.
Figure 19: Harnessing Email Data for Research (a basic sequence)
Conclusion
Finally, for many researchers, email collections are not considered common resources for data analysis. Email often goes unexploited and unexplored in a research context. The ease of access to the data with a common qualitative (and mixed methods, and multi-methods) data analytics tool may help change research practices. It may broaden what people use to understand various phenomena.
About the Author
Shalin Hai-Jew works as an instructional designer at Kansas State University. Her email is shalin@ksu.edu.
| Previous page on path | Cover, page 11 of 18 | Next page on path |
Discussion of "Some Ways to Use Outlook Email Data in NVivo"
Add your voice to this discussion.
Checking your signed in status ...