Academic Publishing Metrics, In-World Influence, and Academic Reputation
By Shalin Hai-Jew, Kansas State University
Bornmann, L. (2014). Do altmetrics point to the broader impact of research? An overview of benefits and disadvantages of altmetrics. Journal of Informetrics, 8(4), 895-903.
Erdt, M., Nagarajan, A., Sin, S-C. J., & Theng, Y-L. (2016). Altmetrics: An analysis of the state-of-the-art in measuring research impact on social media. Scientometrics, 109, 1117- 1166.
Glänzel, W., & Gorraiz, J. (2015). Usage metrics versus altmetrics: Confusing terminology? Scientometrics, 102, 2161 – 2164.
Godin, B. (2006). On the origins of bibliometrics. Scientometrics, 68(1), 109 – 133.
Haustein, S. (2016). Grand challenges in altmetrics: Heterogeneity, data quality and dependencies. Scientometrics, 108, 413 – 423.
Haustein, S., Bowman, T. D., & Costas, R. (2015). Interpreting" altmetrics": Viewing acts on social media through the lens of citation and social theories. arXiv preprint arXiv:1502.05701.
Haustein, S., Peters, I., Bar-Ilan, J., Priem, J., Shema, H., & Terliesner, J. (2014). Coverage and adoption of altmetrics sources in the bibliometric community. Scientometrics, 101, 1145 – 1163.
Ingwersen, P. (2006). Webometrics: ten years of expansion. An invited plenary talk. 1 – 4.
Jacobs, D. (2010). Demystification of bibliometrics, scientometrics, informetrics and webometrics. In the proceedings of the 11th DIS Annual Conference 2010. Sept. 2 – 3, 2010. Richardsbay, University of Zululand, South Africa.
Johnson, I.M. (2011). Bibliometrics and the brain dead: Education for librarianship and information studies: Fit for purpose? Information Development, 27(2), 92 – 93.
Konkiel, S., & Scherer, D. (2013). New opportunities for repositories in the age of altmetrics. Bulletin of the American Society for Information Science and Technology, 39(4), 22-26.
Kurtz, M. J., & Bollen, J. (2011). Usage bibliometrics. arXiv preprint arXiv:1102.2891, 1 - 64.
Kwok, R. (2013, Aug.) Altmetrics make their mark: Alternative measures can yield useful data on achievement—but must be used cautiously. Nature, 500, 491 – 493.
Melero, R. (2015). Altmetrics—a complement to conventional metrics. Biochemia Medica, 25(2), 152 – 160.
Mounce, R. (2013, Apr. / May). Open access and altmetrics: Distinct but complementary. Bulletin of the Association for Information Science and Technology, 39(4), 14 - 17.
The current challenges with SARS-CoV-2 and unprecedented budgetary pressures in higher education mean that employees are experiencing warranted job anxieties. Administrators have to balance the budgets and make do with less, and given how much of a budget goes to wages, they have to decide which positions to keep and which to drop (whether by furlough or layoffs or other means).
Shining in Academia
In academia and other workplaces, employees have always had to justify their value. Common strategies involve working both within role but also outside role responsibilities. With collaborative work, optimally, the work should not only benefit others but redound with some benefit to one’s own skillsets, reputation, and connections. In this game, pursuing grant funds is a plus, whether the projects are ultimately funded or not. Getting positive mass-scale press coverage is a positive, particularly if the coverage is by a prestige organization or a recognizable celebrity. Brokering a project between various entities on a campus can be powerful for social capital. Rolling out a new patented product or process, especially if these result in royalty dollars and breakthrough practices or products, ditto. Showing a clever way to teach…very positive. The core driver is to contribute to the world in a noticeable way but allowing others to offer the kudos. [Ideally, at any one time, there would be multiple people who would be capable of shepherding an idea into existence and into reality, but in some cases, it seems like there may only be an individual in the world with the particular mix of experiences, training, positionality, and skills to execute on an idea. There is only “one point of failure,” which is a high risk to the world. Such fragilities mean more vulnerabilities in the world—that certain outcomes may not be achievable.]
There are various possible efforts, too, short of something glamorous. In a public land grant university with top-level research standing, there should be contributions to the teaching, the research, and the service (extension). One strategy is to be a “bean counter,” by recording one’s own “counted” work—to chase credit and manage impressions [publicly, vertically (to supervisors, reportees) and horizontally (to colleagues)]. This is a type of public face-making, a telling of a professional autobiography of skills, creative thinking, professional relationships, and social finesse. For some, they are on a road to promotion; for most, they are self-promoting just to tread water and meet minimum requirements.
Introduction
One area of academic self-promotion is in publishing. This is one of the most status-focused aspects of academia. This is about originality and contribution. This is about respect from professional colleagues. This is about legacy. This is about justifying grant funding. In a few rare cases, this is about patents, decisions made in the world, respect from others, and competitive advantage.
At present, there are a number of technologies that enable this:
- Social research sharing sites (sites where people may share about their research work and publications to find broader audiences, to make professional connections, to network and to build social networks)
- Open-access publishing sites (with some built-in audiences and user bases)
- Slideshow sharing sites
- Social media (including target research groups), and others
There is a cost (in attention, in effort, in privacy, in data sharing) to joining various free sites. In my experience, the memberships can goose numbers a little and feel like affirmation, but in terms of actual collaborations, they’re not particularly helpful. And there are usually many requests for free copies of published copyrighted chapters and articles and pre-drafts and a great reluctance to actually pay the nominal costs to access a work that likely cost thousands of dollars in IP for the literature review alone…not even counting any invested hours, research, data scraping, collaborations, technologies, and so on. In the literature, there is controversy over counting methods, the amount of confidence placed on metrics, and the senses of those who count. Indeed, counting views, downloads, or reads are only light proxies for so-called “relevance” or “influence.” Sometimes, these only mean popularity or name recognition or some fad.
Then, further, there are various technologies that collect academic publishing metrics; they count and rank; they validate or invalidate. Basically, these are biblio-, alt-, and webo-metrics, among others. Usage metrics, in a general sense, have been in use for many years.
Usage metrics have already been around much longer than altmetrics. In fact, usage metrics are even older than citation metrics, because librarians have been tracking usage since the beginning of their profession, ranging from basic user surveys to the usage tracking of physical journal issues and monographs to library loan statistics to the sophisticated analysis of e-media usage (e-metrics). (Glänzel & Gorraiz, 2014, p. 2161)
The counts are used to create rank orders. A common rank approach is the H-index (Hirsch index / number) to measure “both the productivity and citation impact of the publications of a scientist or scholar” as well as the same factors of scholarly journals. [This index was created in 2005 by Jorge E. Hirsch, a physicist at UC San Diego.] In highly competitive work places, employees are ranked continuously, and the bottom third are at constant risk of release.
Of late, there are various combinations of analyses, including (social) (content) network analysis of individual researchers, research teams, particular published works, and others. These methods are used to map disciplines, from beginning to end (or to the present); in this application, there are resulting knowledge domain visualizations and maps. Various bibliometrics are complemented with qualitative data analytics methods, too. This article summarizes some of these approaches, according to the research literature.
About Bibliometrics, Webometrics, and Altmetrics
“Bibliometrics” refers to common citation metrics and are more traditional and formal. These focus on citations of previous research by fellow researchers in formal peer-reviewed and refereed publications. These are a kind of “lagging indicator” because of the amount of time taken to consume another’s article and to integrate it into a research work. Bibliometrics is “generally defined (Broadus, 1987) as the quantitative study of published units on the basis of citation and text analysis, but can include studies based on usage data” (Kurtz & Bollen, 2011, p. 4). Bibliometrics used to create applied “performance indicators” is referred to as “evaluative bibliometrics” and originated formally in 1972 (Narin, Olivastro, & Stevens, Feb. 1994, p. 65). “Relational bibliometrics” refers to the examination of relations between research in particular areas, such as through co-citation methods (Jacobs, 2010, p. 4).
“Altmetrics” refers to “alternate metrics” (alternate to citation metrics) (Glänzel & Gorraiz, 2014, p. 2162). These are more nontraditional methods of counting usage of published academic articles (and also datasets, videos, and other materials). Altmetrics involves the application of social media “as a source of metrics to assess scholarly impact” (Erdt, Nagarajan, Sin, & Theng, 2016, p. 1117).
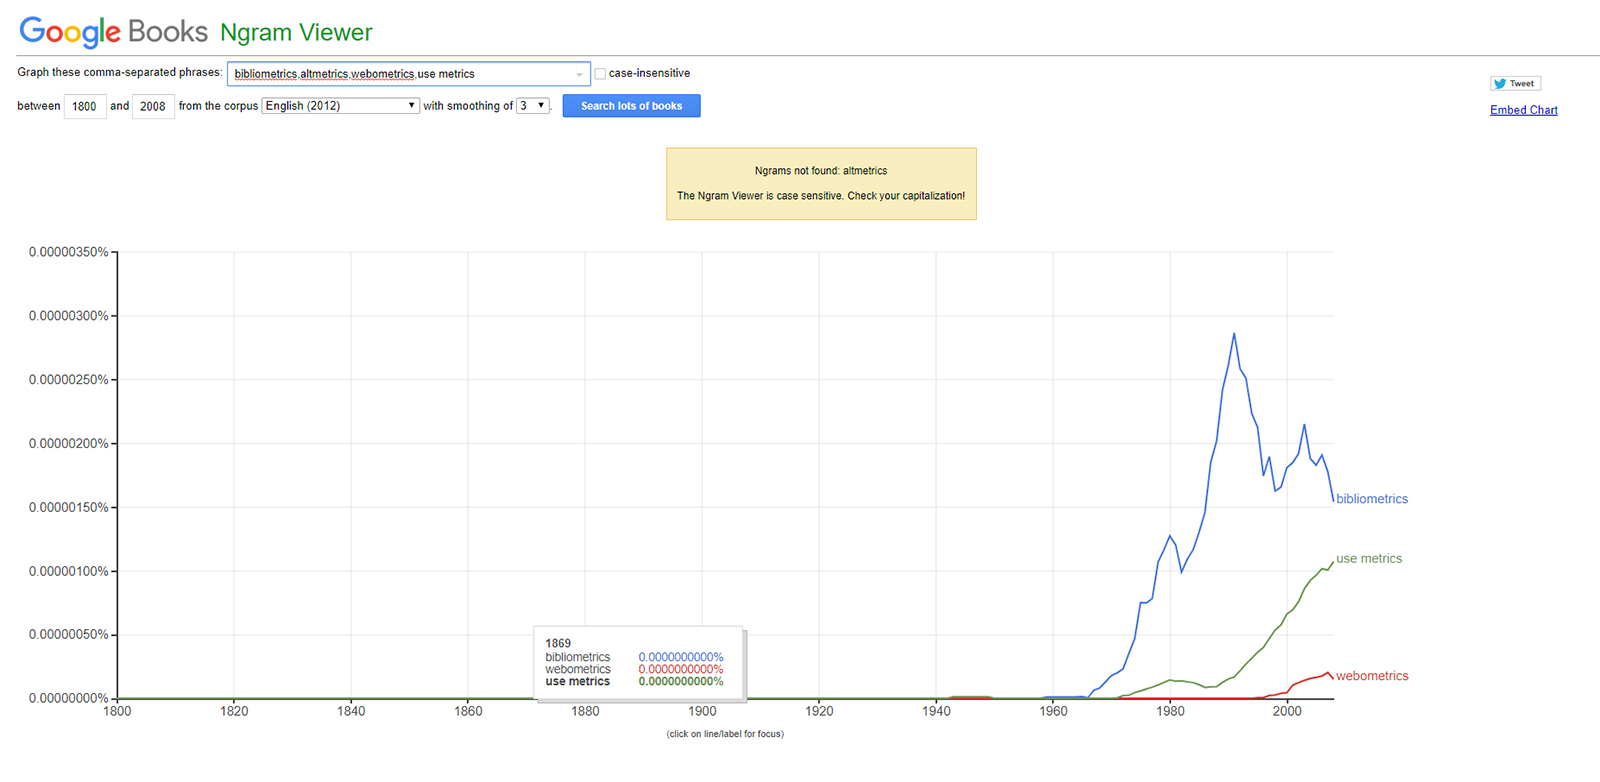
“Webometrics” refers to various types of counts of accesses to web-based contents. In different research contexts, these terms are defined somewhat differently. “Use Metrics” is a more general category that includes various ways to understand usage of particular resources. In the Google Books Ngram Viewer, all of the terms show up in the English corpus from 1800 – 2000 except for “altmetrics,” which may be a more recent term with little presence in book literature. (The linegraph may be viewed in Figure 1.) Interestingly, word frequency counts are part of conventional bibliometric technique (Thelwall, 2008, p. 606).
Figure 1: Bibliometrics, Use Metrics, Webometrics (but no Altmetrics) on Google Books Ngram Viewer
Part 1: Bibliometrics
Psychologists started the practice of counting publications in the early 1900s to better understand their discipline (Godin, 2006, p. 109), and their work is considered the pre-history to bibliometrics (measures about books, book contents, texts).
In particular, James McKeen Cattell, an American psychologist and editor of Science (1895 – 1944) conducted “the first systematic collection of statistics on science” (Godin, 2006, p. 109), with a focus on “quantity and quality” (p. 110). In the intervening years, bibliometrics became a field of study in library sciences and information sciences, beginning in the late 1950s and early 1960s. Bibliometrics involves the measure of “properties of documents, and of document-related processes” (Borgman & Furner, 2002, as cited in Thelwall, 2008, p. 606). Bibliometrics may involve counts “intrinsic” to a text (within a text, like word frequencies) or “extrinsic” to it (author, author ties, citations and references, usage).
Bibliometrics (“statistical bibliography”) may have expanded definitions for particular research. One study includes melding traditional bibliometrics with usage data, including “describing and modeling individual user behavior…to improve user interfaces and to study user motivations” and “ranking an article or an author as a function of usage” (Kurtz & Bollen, 2011, p. 5). Bibliometric analysis focuses on the counts of articles and patents, the impact of that production (by citation and reference), and “linkage measurement” of “citations from articles to articles, from patents to patents, and from patents to articles” to understand “intellectual linkages between the organizations that are producing the patents and articles, and the knowledge linkage between their subject areas” (Narin, Olivastro, & Stevens, Feb. 1994, p. 66).
Different disciplines have their own “bibliographical peculiarities, such as preferred containers (journals, books, etc.), time windows for citations, average amount of citations per author, and so on, so that comparisons have to be performed among peers if they are to be significant” (Rovira Esteva & Franco Aixelá, 2018, p. 6). Research collaborations are another sub-area of research interest (Jacobs, 2010, p. 5).
Practically, article citations “are an acceptable and correct proxy for the measure of publications impact, however, only for a subset of the scientific community, namely the ‘publish or perish’ group and only of the impact reflected by documented scholarly communication” (Glänzel & Gorraiz, 2014, p. 2163). And yet, there is importance in reaching wider audiences. With the popularization of the Internet and Web, various electronic libraries, electronic publications, repositories, referatories, database sharing sites, slideshow sharing sites, research communities, research sharing sites, and other resources went live. The easy access to logged trace data and other information enabled expanding beyond traditional bibliometrics (mostly based on paper or print resources) to digital contents for web publishing and social sharing. Particularly, the data could be large-scale, real-time, and broadly proliferated.
Part 2: Webometrics
Tomas Almind and Peter Ingwersen coined the term “webometrics” in 1997 (Thelwall, Aug. – Sept. 2012, p. 18) in recognition of the informetrics potential of the World Wide Web as an information space. Webometrics is defined as “the quantitative study of Web-related phenomena” such as data from large-scale commercial search engines (Thelwall, Vaughan, & Björneborn, 2005, p. 81) and is predicated on the idea that the web is “an enormous document repository” including objects from academics (Thelwall, 2008, p. 611). Initial webometric research was published in 2006 “in the form of link analyses and distributions of websites over countries and domains” (Ingwersen, 2006, p. 1). “Cybermetrics” is a more general term and refers to the study of the Internet and Internet applications (Ingwersen, 2006, p. 2); another synonymous term seems to be “netometrics,” and this involves studying “the particular conditions of exchange of information on the Internet” (Rovira Esteva & Franco Aixelá, 2018, p. 1). Given the computational understructure of the Web, and the logging of trace and other data, researchers are building on the nature of computation in terms conducting counts and statistical analyses and creating data visualizations. Certainly, there are other terms in use as well.
To contextualize webometrics, co-researchers created a Venn diagram visualization of the various interrelationships between the informetric elements, described as “infor-/biblio-/sciento-/cyber-/webo-/metrics”. “Informetrics” is defined as “the study of the quantitative aspects of information in any form, not just records or bibliographies, and in any social group, not just scientists” (Jacobs, 2010, p. 6). Bibliometrics is a large set within informetrics. Part of bibliometrics includes cybermetrics, within which resides webometrics. The field of scientometrics overlaps a part of bibliometrics, cybermetrics, and webometrics. The core focus of this visual is the shaded webometrics set to provide a sense of the heritage and positioning of this then-fairly new field (Thelwall, Vaughan, & Björneborn, 2005; Björneborn, 2004, as cited in Jacobs, 2010, p. 10). One source clarifies that the respective sizes of the ellipses are made for clarity and may not be representational of the scope of the respective sets. [The visual is reproduced in several later-published works in this space.] The Social Web is also a target of study, with so much that is social and relational occurring in virtual spaces (Ingwersen, 2006, p. 4). Webometrics involves the study of “the way published information flows” (Rovira Esteva & Franco Aixelá, 2018, p. 2), so points of origin, consumption, the spawning of secondary and tertiary and other works. Webometrics is used in “the wider social sciences” (Thelwall, Aug. – Sept. 2012, p. 18).
Some identified shortcomings in webometric analysis involves the lack of quality controls for Web contents and therefore resulting in “lower quality” web data (Thelwall, 2008, p. 616). The lack of data standardization raises the cost of efforts to access relevant web data beyond link data. Publication dates on web pages may be difficult to acquire. Some articles are behind paywalls and so are not freely accessible. Websites vary in quality of information shared publicly by the respective researchers. (p. 616)
In webometrics, some common methods include node-link diagramming, with various types of relational linkage (Thelwall, Vaughan, & Björneborn, 2005), among others. Web log files are sources of data (Thelwall, Vaughan, & Björneborn, 2005, p. 95) but requiring proper processing. In terms of academic publications, web metrics studies include publications, authors, websites, national university systems, international universities, disciplines, and other focuses (Thelwall, Vaughan, & Björneborn, 2005).
The popularization of webometrics enabled the advent of alternative metrics (altmetrics) for understanding academic influence.
Part 3: Altmetrics
“Altmetrics” refers to “alternative metrics,” and these generally refer to “social web metrics for academic publications” (Sud & Thelwall, 2013, p. 1131). They are “a new group of metrics based (largely) on social media events relating to scholarly communication” (Haustein, Bowman, & Costas, 2015, p. 1). They are “indices based on social media platforms and tools” (Haustein, Peters, Bar-Ilan, Priem, Shema, & Terliesner, 2014, p. 1145). Altmetrics “focuses on the potentialities of social media and academic social networks and tries to downplay the role played by international indexes and citation counting” (Rovira Esteva & Franco Aixelá, 2018, p. 1). Altmetrics research involves the study of data from a variety of sources: career sites, social networking sites, discussion forums, microblogging platforms, social content sharing sites, news sites, pinning sites, social bookmarking, wikis, weblogs or blogs, social recommender sites with upvotes and downvotes, and others.
Altmetrics are thought to be able to “give early estimates of the impact of publications or to give estimates of non-traditional types of impact” (Sud & Thelwall, 2013, p. 1131). In altmetrics, some evaluation strategies here include “correlation tests, content analyses, interviews and pragmatic analyses” (Sud & Thelwall, 2013, p. 1131). Altmetrics providers may focus on particular aspects of academia or research, such as shared research data (which was found to “remain mostly uncited” at the 85% range) (Peters, Kraker, Lex, Gumpenberger, & Gorraiz, 2016, p. 723). The study found “no correlation between the number of citations and the total number of altmetrics scores” but did find that “survey, aggregate data, and sequence data” were more cited and received higher altmetrics scores than other types of shared data (Peters, Kraker, Lex, Gumpenberger, & Gorraiz, 2016, p. 724).
Altmetrics data can be built into “recommender systems” to point to popular articles for reading (Sud & Thelwall, 2013, p. 1131). Some use altmetrics ratings and indicators to filter relevant articles (for non-experts) to read, given the time investment to engaging academic works (Sud & Thelwall, 2013, pp. 1131 - 1132). As of 2016, the world output “2.5 million articles per year and doubling every 9 years” (Warren, Raison, & Dasgupta, 2016, p. 131), with only a small amount potentially relevant for a research application. In this case, the so-called “Altmetric Donut” which aggregates mentions from a number of social media sources may indicate something of the “dissemination of a research output” to various audiences through various social media sources (Warren, Raison, & Dasgupta, 2016, p. 132). Other researchers observe that Google Scholar “orders search matches in approximately decreasing order of citation” (Thelwall, Haustein, Larivière, & Sugimoto, 2013, p. 1), which makes popular works more discoverable (through an amplification effect).
Some have viewed altmetrics as “potential democratizers of the scientific reward system and indicators of societal impact” given its being drawn from heterogeneous data sources (Haustein, 2016, p. 413). Altmetrics are thought to enable vision into the broader impact of research (not in an ivory tower) beyond academia alone. Such measures provide a sense of public “engagement with research output” (Bornmann, 2014, p. 2). Institutional repositories are seen to benefit from altmetrics, which include various data, including “download counts at the collection and/or item level, search terms, total and unique visitors, page views and social media and bookmarking metrics” and can show “scholarly and popular impact, show readership, reflect an institution’s output, justify tenure and promotion and indicate direction for collection management” (Konkiel & Scherer, 2013, p. 22). In such contexts, altmetrics may advance institution and researcher (depositor) interests through the repository and its holdings. Likewise, open access publishing is projected to development in complementary ways with altmetrics because of various alignments and mutualities (Mounce, Apr. / May 2013, p. 14).
Social media discussions may encourage a second look at a publication, through the power of electronic Word of Mouth (e-WOM). It may help people decide the following: “What paper should I read next? Who should I talk to at a conference? Which research group should get this grant?” (Priem, Groth, & Taraborelli, 2012, p. 1)
A study into the efficacy of altmetrics did identify statistically significant associations “between higher metric scores and higher citations for articles with positive altmetric scores in all cases with sufficient evidence (Twitter, Facebook wall posts, research highlights, blogs, mainstream media and forums) except perhaps for Google+ posts” (Thelwall, Haustein, Larivière, & Sugimoto, 2013, p. 1). This study found insufficient evidence “for LinkedIn, Pinterest, question and answer sites, and Reddit, and no conclusions should be drawn about articles with zero altmetric scores or the strength of any correlation between altmetrics and citations” (Thelwall, Haustein, Larivière, & Sugimoto, 2013, p. 1). In another study, Mendeley was found to provide “metrics on readerships for 62.6% of all the publications studied” as compared to other sources which only provided “marginal information”; further, Mendeley readership was related to citations with a moderate spearman correlation of r = 0.49 (Zahedi, Costas, & Wouters, 2014, p. 1491).
There are some go-to altmetric sources that are validated as more powerful indicators of scholarly relevance than others. The differences may be attributed in part to the user base (the size, the ties to academia), which uses each particular source. There may be other factors, like the respective algorithms, the particular domains, and others.
One of the strengths of altmetrics is that these “offer fast, real-time indications of impact…are openly accessible and transparent…include a broader non-academic audience, and cover more diverse research outputs and sources” (Wouters & Costas, 2012, as cited in Erdt, Nagarajan, Sin, & Theng, 2016, p. 1118). However, altmetric scores for scholarly impact are time-sensitive with rankings changing continuously (Thelwall, Haustein, Larivière, & Sugimoto, 2013, p. 1), given the dynamism of the online spaces. Another study found that the “amount of use of a particular altmetrics source seemed to vary dramatically between communities and over time, likely reflecting differing community norms and the volatility of early-adopter’s interest” (Priem, Piwowar, & Hemminger, Oct. 2011, p. 3).
Other researchers have noted that some articles “may be heavily read and saved by scholars but seldom cited” (Priem, Piwowar, & Hemminger, Mar. 2012, p. 1). Different altmetrics may get at different aspects of usage, and they may be used in complementary ways to understand actual usage.
Credibility of the Counts / Miscounts
Researchers have long advocated the need for “methodologically sound approaches” in bibliographic analyses to ensure robust and reliable findings (Rovira Esteva & Franco Aixelá, 2018, p. 8).
The Leiden Manifesto for Research Metrics (2014) includes 10 principles for research evaluation, and these are applicable to understanding various use metrics. They include the following:
- "Quantitative evaluation should support qualitative, expert assessment.
- Measure performance against the research missions of the institution, group or researcher.
- Protect excellence in locally relevant research.
- Keep data collection and analytical processes open, transparent and simple.
- Allow those evaluated to verify data and analysis.
- Account for variation by field in publication and citation practices.
- Base assessment of individual researchers on a qualitative judgment of their portfolio.
- Avoid misplaced concreteness and false precision.
- Recognize the systemic effects of assessment and indicators.
- Scrutinize indicators regularly and update them." (Leiden Manifesto for Research Metrics, 2014, as cited in Melero, 2015, p. 153)
Altmetrics are not thought to have sufficient power to substitute or replace bibliometrics but to complement them. One research team, in their meta-analysis of altmetrics research, found “a weak correlation (ranging from 0.08 to 0.5) between altmetrics and citation counts, confirming that altmetrics do indeed measure a different kind of research impact, thus acting as a complement rather than a substitute to traditional metrics” (Erdt, Nagarajan, Sin, & Theng, 2016, p. 1117). Their work included the study of altmetrics aggregators, which collect local data from yet other sources and apply various calculations to come out with academic impact scores.
There have been critiques of bibliometrics and webometrics as too superficial and leading to “braindead” approaches (Johnson, 2011) to understanding academic production. Others suggest that citations “reflect only limited spectrum of uses, leaving others invisible” (Priem, Piwowar, & Hemminger, Oct. 2011, p. 1).
The presence of academic counting changes up incentives for strategic messaging. For example, researchers have long engaged in self-citation, so that their counts of article citations look higher. (Part of this self-citation is also because researchers are building on their own prior work, and the self-citations show the coherence of their thinking over time.)
How credible various metrics are will vary. For social metrics, a common strategy involves quid pro quos, with each vouching for the other’s reputations, in mutual grooming, with shout-outs and “inside jokes” and “fake feuds” to which the world is invited. There are anecdotal cases of where altmetrics makes the differences in how well a work is read (Kwok, Aug. 2013, p. 491). Electronic word-of-mouth (e-WOM) can drive traffic to a work, but many “shares” on social media are by people who have not actually read or opened the original work; the reshares are almost rote, for many. Another approach involves forced social bragging through microblogging messages, shared videos, shared photos (group selfies?), and other shares in the social space…and then public research and data and articles in the academic space.
Yet Other Metrics in the Academic Space
In the past few years, I have noticed some other types of spinoff third-party “counters” online, such as the numbers of reviews of draft articles and chapters. Being asked to review something may be indicative of expertise, but it may also have something to do with responsiveness and availability. Some may think those who are asked to review are those who give an easy pass, but that has not been my experience. Without a critical eye, a reviewer will not truly add value to the review, and the draft works will not be improved and will go out to the broad public with mistakes intact. That is not in the interests of any of the stakeholders. I also have noticed that the best reviewers are those who respect their work and also respect people: publishers, editors, researchers, authors, data analysts, illustrators, readers, students, and so on. Another change is a move from double-blind and single-blind peer reviews to fully transparent ones, with reviewers’ names attached. If a work is declined by one publisher, that publisher may pass on the original draft along with reviews to other publishers. Any engagement in this space involves liabilities, particularly in relation to others’ reputations and career paths. (In other words, conducting reviews is fairly thankless.)
Conclusion
With these measuring approaches, the value of a work depends in large part on its usage and the amount of public mindshare (or the attention of significant individuals) that can be acquired, by any means. The value of works depend on various factors, and these vary in different disciplines. Bibliometrics, webometics, and altmetrics are all proxy measures of influence, and they all have gaps. However, expert analyses involve subjectivities and personal preferences. Every approach has its strengths and weaknesses, and various tradeoffs.
In an attention economy, most created contents, like books, become part of the Great Unread (per Margaret Cohen). Many works go straight to archives where they may or may not be discovered in the future. In some cases, the works may be “read” by machines or at least noted by ‘bots and crawlers but not human consciousnesses.
People necessarily have to be self-interested and build new skills. Sharing glam photos and engaging in some hype may be a necessary part of the competitive landscape. Similarly, people protecting their self-esteem is important, but stretching to the point of “imposter syndrome” and over-claiming and dishonesty crosses many ethical lines. At some point, it helps if we check ourselves and return to Earth. I am reminded of an athletic concept of “personal best,” the idea that while we strive with others, we also have to reach our best potential. In old days, people would sit on a website and refresh ad nauseam to create the impression of popularity, of views. Actually, this practice of gaming systems still occurs today, which means that apparent claims to skill and knowledge should be approached somewhat skeptically. (This is especially so when all sorts of social media accounts are created around faked identities and populated with “cyborgs”—live people and automated scripts.)
Information consumers will evaluate others by looking at baseline and averages; they will assess from various data points. They will view exceptions and anomalies with skepticism. Anyone worth their salt in a field conducts due diligence and exercises sufficient caution (mixed with strategic risk-taking). All to say that various use metrics are applied in academic publishing for reputation-building and burnishment. That said, professional reputations are built on various dimensions: collegiality, biography, various intellectual lineages, politics, nationality, interests, hobbies, and what-not. Third-party entities that conduct counts use the numbers as “proxy” reputations in “escrow,” and most look at such metrics only lightly. Webometrics may be used to “assess the extent to which researchers are successful in publicizing their work online” (Thelwall, 2008, p. 617).
References
Erdt, M., Nagarajan, A., Sin, S-C. J., & Theng, Y-L. (2016). Altmetrics: An analysis of the state-of-the-art in measuring research impact on social media. Scientometrics, 109, 1117- 1166.
Glänzel, W., & Gorraiz, J. (2015). Usage metrics versus altmetrics: Confusing terminology? Scientometrics, 102, 2161 – 2164.
Godin, B. (2006). On the origins of bibliometrics. Scientometrics, 68(1), 109 – 133.
Haustein, S. (2016). Grand challenges in altmetrics: Heterogeneity, data quality and dependencies. Scientometrics, 108, 413 – 423.
Haustein, S., Bowman, T. D., & Costas, R. (2015). Interpreting" altmetrics": Viewing acts on social media through the lens of citation and social theories. arXiv preprint arXiv:1502.05701.
Haustein, S., Peters, I., Bar-Ilan, J., Priem, J., Shema, H., & Terliesner, J. (2014). Coverage and adoption of altmetrics sources in the bibliometric community. Scientometrics, 101, 1145 – 1163.
Ingwersen, P. (2006). Webometrics: ten years of expansion. An invited plenary talk. 1 – 4.
Jacobs, D. (2010). Demystification of bibliometrics, scientometrics, informetrics and webometrics. In the proceedings of the 11th DIS Annual Conference 2010. Sept. 2 – 3, 2010. Richardsbay, University of Zululand, South Africa.
Johnson, I.M. (2011). Bibliometrics and the brain dead: Education for librarianship and information studies: Fit for purpose? Information Development, 27(2), 92 – 93.
Konkiel, S., & Scherer, D. (2013). New opportunities for repositories in the age of altmetrics. Bulletin of the American Society for Information Science and Technology, 39(4), 22-26.
Kurtz, M. J., & Bollen, J. (2011). Usage bibliometrics. arXiv preprint arXiv:1102.2891, 1 - 64.
Kwok, R. (2013, Aug.) Altmetrics make their mark: Alternative measures can yield useful data on achievement—but must be used cautiously. Nature, 500, 491 – 493.
Melero, R. (2015). Altmetrics—a complement to conventional metrics. Biochemia Medica, 25(2), 152 – 160.
Mounce, R. (2013, Apr. / May). Open access and altmetrics: Distinct but complementary. Bulletin of the Association for Information Science and Technology, 39(4), 14 - 17.
Narin, F., Olivastro, D., & Stevens, K.A. (1994, Feb.) Bibliometrics/Theory, Practice and Problems. Evaluation Review, 18(1), 65 – 76.
Peters, I., Kraker, P., Lex, E., Gumpenberger, C., & Gorraiz, J. (2016). Research data explored: An extended analysis of citations and altmetrics. Scientometrics, 107, 723 – 744.
Peters, I., Kraker, P., Lex, E., Gumpenberger, C., & Gorraiz, J. (2015). Research data explored: Citations versus altmetrics. arXiv preprint arXiv:1501.03342.
Priem, J., Groth, P., & Taraborelli, D. (2012). The altmetrics collection. PLOS One, 7(11), 1 – 6.
Priem, J., Piwowar, H.A., & Hemminger, B.H. (2011, October). Altmetrics in the wild: An exploratory study of impact metrics based on social media. In Metrics 2011: Symposium on Informetric and Scientometric Research. New Orleans, USA.
Priem, J., Piwowar, H.A., & Hemminger, B.M. (2012, Mar.) Altmetrics in the wild: Using social media to explore scholarly impact. arXiv: 1203.4745, 1 – 30.
Rovira-Esteva, S., & Franco Aixelá, J. (2018). Bibliometric Tools: Evaluation, Mapping. Chapter 2.3. A Lieven D’hulst & Yves Gambier (eds.). A History of Modern Translation Knowledge. Sources, concepts, effects. Benjamins Translation Library, 142. John Benjamins. Pp. 117-122. DOI: 10.1075/btl.142.15rov.
Sud, P., & Thelwall, M. (2013). Evaluating altmetrics. Scientometrics, 98, 1131 – 1143.
Thelwall, M. (2008). Bibliometrics to webometrics. Journal of Information Science, 34(4), 605-621.
Thelwall, M. (2012, Aug. – Sept.) A history of webometrics. Bulletin of the American Society for Information Science and Technology, 38(6), 18 – 23.
Thelwall, M., Haustein, S., Larivière, V., & Sugimoto, C.R. (2013). Do altmetrics work? Twitter and ten other Social Web services. PLOS One, 8(5), 1 – 7.
Thelwall, M., Vaughan, L., & Björneborn, L. (2005). Webometrics. Annual Review of Information Science and Technology, 39(1), 81-135.
Warren, H.R., Raison, N., & Dasgupta, P. (2016). The rise of altmetrics. JAMA, 317(2), 131 – 132.
Zahedi, Z., Costas, R., & Wouters, P. (2014). How well developed are altmetrics? A cross-disciplinary analysis of the presence of ‘alternative metrics’ in scientific publications. Scientometrics, 101, 1491 – 1513.
Shalin Hai-Jew works as an instructional designer and data analyst at Kansas State University. Her email is shalin@ksu.edu.
Peters, I., Kraker, P., Lex, E., Gumpenberger, C., & Gorraiz, J. (2016). Research data explored: An extended analysis of citations and altmetrics. Scientometrics, 107, 723 – 744.
Peters, I., Kraker, P., Lex, E., Gumpenberger, C., & Gorraiz, J. (2015). Research data explored: Citations versus altmetrics. arXiv preprint arXiv:1501.03342.
Priem, J., Groth, P., & Taraborelli, D. (2012). The altmetrics collection. PLOS One, 7(11), 1 – 6.
Priem, J., Piwowar, H.A., & Hemminger, B.H. (2011, October). Altmetrics in the wild: An exploratory study of impact metrics based on social media. In Metrics 2011: Symposium on Informetric and Scientometric Research. New Orleans, USA.
Priem, J., Piwowar, H.A., & Hemminger, B.M. (2012, Mar.) Altmetrics in the wild: Using social media to explore scholarly impact. arXiv: 1203.4745, 1 – 30.
Rovira-Esteva, S., & Franco Aixelá, J. (2018). Bibliometric Tools: Evaluation, Mapping. Chapter 2.3. A Lieven D’hulst & Yves Gambier (eds.). A History of Modern Translation Knowledge. Sources, concepts, effects. Benjamins Translation Library, 142. John Benjamins. Pp. 117-122. DOI: 10.1075/btl.142.15rov.
Sud, P., & Thelwall, M. (2013). Evaluating altmetrics. Scientometrics, 98, 1131 – 1143.
Thelwall, M. (2008). Bibliometrics to webometrics. Journal of Information Science, 34(4), 605-621.
Thelwall, M. (2012, Aug. – Sept.) A history of webometrics. Bulletin of the American Society for Information Science and Technology, 38(6), 18 – 23.
Thelwall, M., Haustein, S., Larivière, V., & Sugimoto, C.R. (2013). Do altmetrics work? Twitter and ten other Social Web services. PLOS One, 8(5), 1 – 7.
Thelwall, M., Vaughan, L., & Björneborn, L. (2005). Webometrics. Annual Review of Information Science and Technology, 39(1), 81-135.
Warren, H.R., Raison, N., & Dasgupta, P. (2016). The rise of altmetrics. JAMA, 317(2), 131 – 132.
Zahedi, Z., Costas, R., & Wouters, P. (2014). How well developed are altmetrics? A cross-disciplinary analysis of the presence of ‘alternative metrics’ in scientific publications. Scientometrics, 101, 1491 – 1513.
About the Author
Shalin Hai-Jew works as an instructional designer and data analyst at Kansas State University. Her email is shalin@ksu.edu.
ORCID ID: 0000-0002-8863-0175 (https://orcid.org/0000-0002-8863-0175)
ResearcherID: J-3022-2018
Publons Profile: https://publons.com/author/1268346/shalin-hai-jew#profile
Google Scholar Citations: https://scholar.google.com/citations?user=0ungL5gAAAAJ&hl
| Previous page on path | Cover, page 9 of 18 | Next page on path |
Discussion of "Academic Publishing Metrics, In-World Influence, and Academic Reputation"
Add your voice to this discussion.
Checking your signed in status ...