Sentiment Analysis of Real-Time Twitter Data
By Jiena G. McLellan, The Beef Cattle Institute, Kansas State University
Abstract
Sentiment analysis is a popular topic in the big data era. In the business world, there is an increasing need for analyzing and characterizing the public’s attitude towards new products. Therefore, sentiment analysis with real-time Twitter data can be a useful tool for business marketing.
In this article, a sentiment analysis was performed with real-time Twitter data that contains customized keywords. There are three parts of this article:
i) fetching real-time data online with keywords;
ii) applying sentiment analysis with Twitter data and visualize each sentimental category with word clouds;
iii) for ease of use, wrapping the sentiment analysis into an interactive dashboard, so users can customize keywords and get the real-time Twitter data.
Introduction
Social media has gradually become the main source of various information about people’s daily life. This is because of the nature of social media, especially Twitter, on which people post in-the-moment tweets about their opinions on a variety of topics, discuss current social issues, complain and express positive sentiment for products they use every day. Therefore, there is a growing need for companies who manufacture products to fetch the Twitter data and get a sense of general sentiment for their product. Sometimes the companies even reply to users on their public social media. Overall, the main goal is to build a technology to detect and summarize an overall sentiment.
There are several challenges to applying sentiment analysis in the business world. Firstly, how to fetch the real-time Twitter data with keywords. Usually, when events break out or new products come out, companies would like to fetch the Twitter data as early as possible, so there is a need to set an operator to fetch the data in real-time. Secondly, the mainly part of the analysis process is to apply sentiment analysis into the data. There are some common challenges of sentiment analysis such as emoji analysis, word order, spelling and certain words that may have a different or opposite meaning in certain situations. Thirdly, building an interactive application for users or analysts to set the keywords they want and visualize the frequent words with word cloud graphs or word count tables. After sentiment analysis, all Twitter data are scored and characterized into positive, neutral or negative. It is very important to visualize Twitter data by each category with meaningful graphs because this process can provide useful information for companies to know what features should be improved. For instance, when a new cell phone comes out, “screen” is the most frequent word in the negative category, this implies that many people complain about the screen of this new cell phone.
Recently, there have been many studies about sentiment analysis for various purposes. For example, Stephan Gouws etc. (2011) applied computational methods and revealed that different populations of users exhibit different amounts of shortened English terms and different shortening styles. Ramnath Balasubramanyan etc. (2011) used multiple machine learning methods to predict comment polarity from the content of political blog posts. In these literature reviews, the sentiment analyses with machine learning methods has been extensively applied into text mining from social media.
However, when evaluating the sentiment of text data, there are some critical challenges which have been discussed through the years. One issue is that emotional reactions are different for different people. Also, based on different topics, people would have different wording to express their sentiments. For example, as a hot topic of “United Airline and overbooking” in April, 2017, the words such as “beat” or “fight” were widely used to express the public’s anger while, in other topics, these words might have completely different meanings. Another challenge from the big data perspective is how to get the real-time, fresh Twitter data so that businesses can have the fresh analysis results.
This report introduces the Twitter data retrieved from online with keywords, data exploration, sentiment analysis by multiple machine learning methods and a real-time shiny app system to retrieve data with the sentiment analysis results.
Data and Method
Data
This study used Twitter data with the keyword “beef.” The data was retrieved from online by “twitteR” R package. Firstly, a Twitter API was set to my account which gave the authentication to fetch Twitter data online by R. Then I used the userTimeline() function to fetch Twitter data from the last two weeks with keywords. After fetching the data, I cleaned it by removing some random meaningless symbols and keeping only English text data.
Data exploration
Geographic information of Twitter data
When using sentiment analysis of Twitter data, businesses, especially those focusing on marketing strategies, want to know where the Twitter data is from because this would give them critical information about their markets. In this study, I used the “ggmap” R package to plot out where the Twitter data is located on a map. In this way, people would have a better idea of the data’s geographic distribution.
Word count of Twitter data
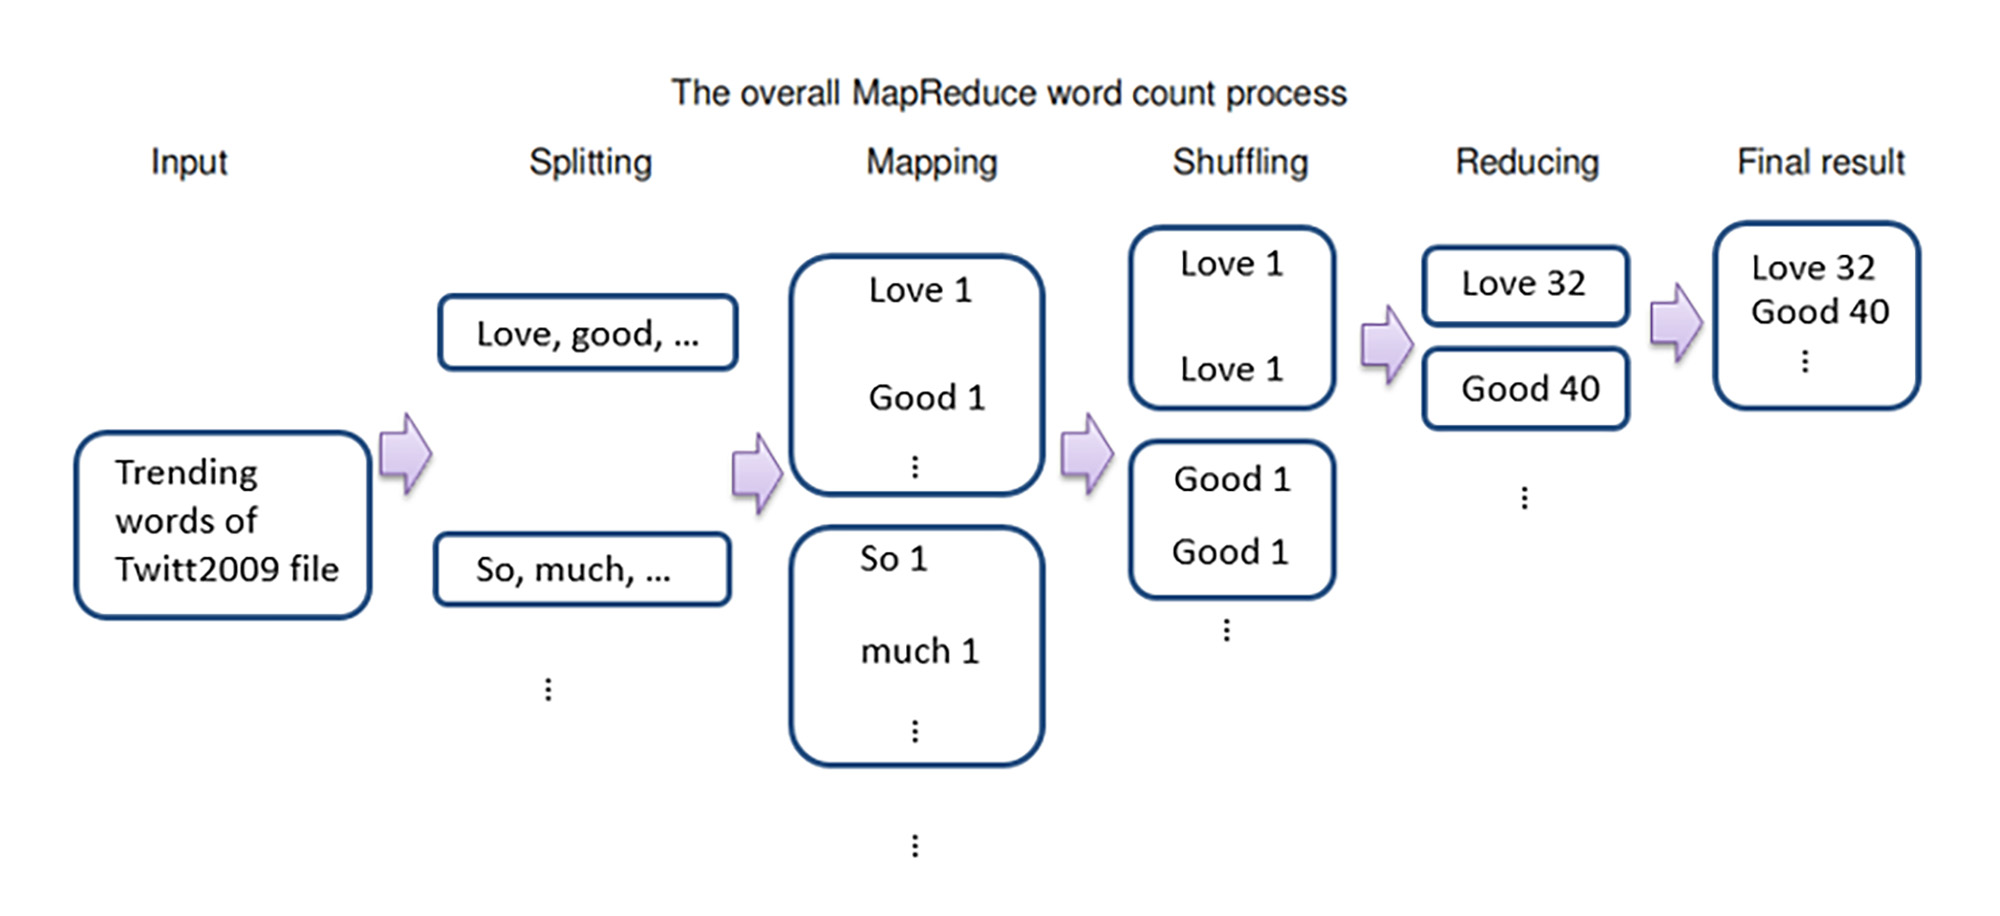
For better understanding of Twitter data, I used MapReduce to create a word count table and make a word cloud graph based on that table. This process explains the MapReduce system.
Figure 1: The Overall MapReduce Word Count Process
Sentiment analysis with multiple machine learning methods
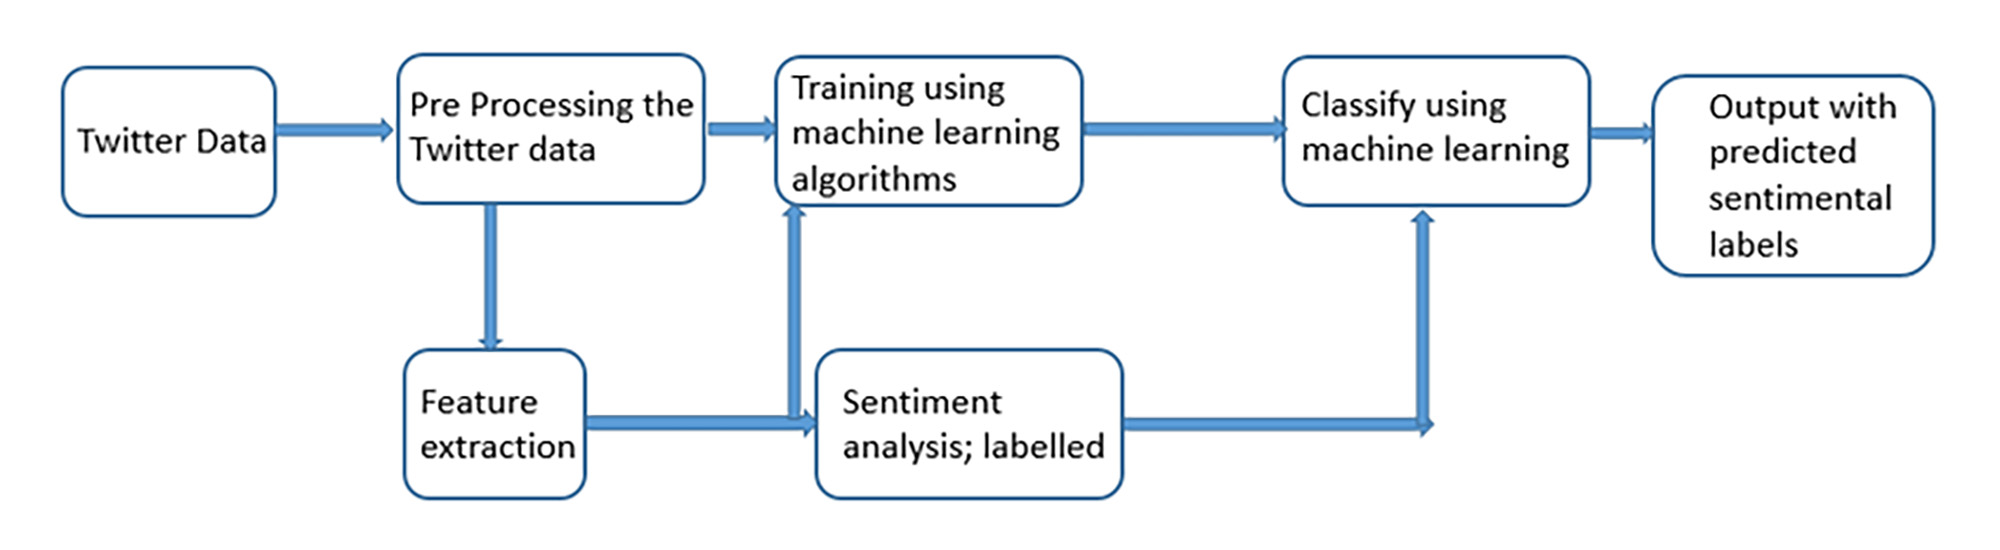
To have a better understanding of Twitter data, I used multiple machine learning methods to evaluate the sentiment of each tweet and characterize the data as positive, neutral or negative. In this study, I used three statistical machine learning methods (SVM, Random forest, Tree) to evaluate the accuracy of each method by some sample data.
Figure 2: Process Flow of Sentiment Analysis of Twitter Data
As with the issue I introduced, based on different topics, people may have different wording to express the sentiments. In this study, besides the three machine learning algorithms, I set certain words for positive or negative expression based on the topic and then used pattern matching to characterize each Twitter data. For example, in this study, the key word is “beef”, so all of Twitter data is about “beef”. I set some certain words such as “delicious”, “juicy”, “taste good”, or “awesome” as a positive expression and set certain words such as “awful” or “taste bad” as negative expression. Then I used these wordings to characterize the Twitter data.
Real-time system for visualizing the Twitter data
For improved business marketing, companies prefer real-time results to create business strategies in a timely fashion.
In this study, I built a shiny app that incorporates sentiment analysis with the real-time Twitter data.
Results
Data exploration
Geographic information of Twitter data
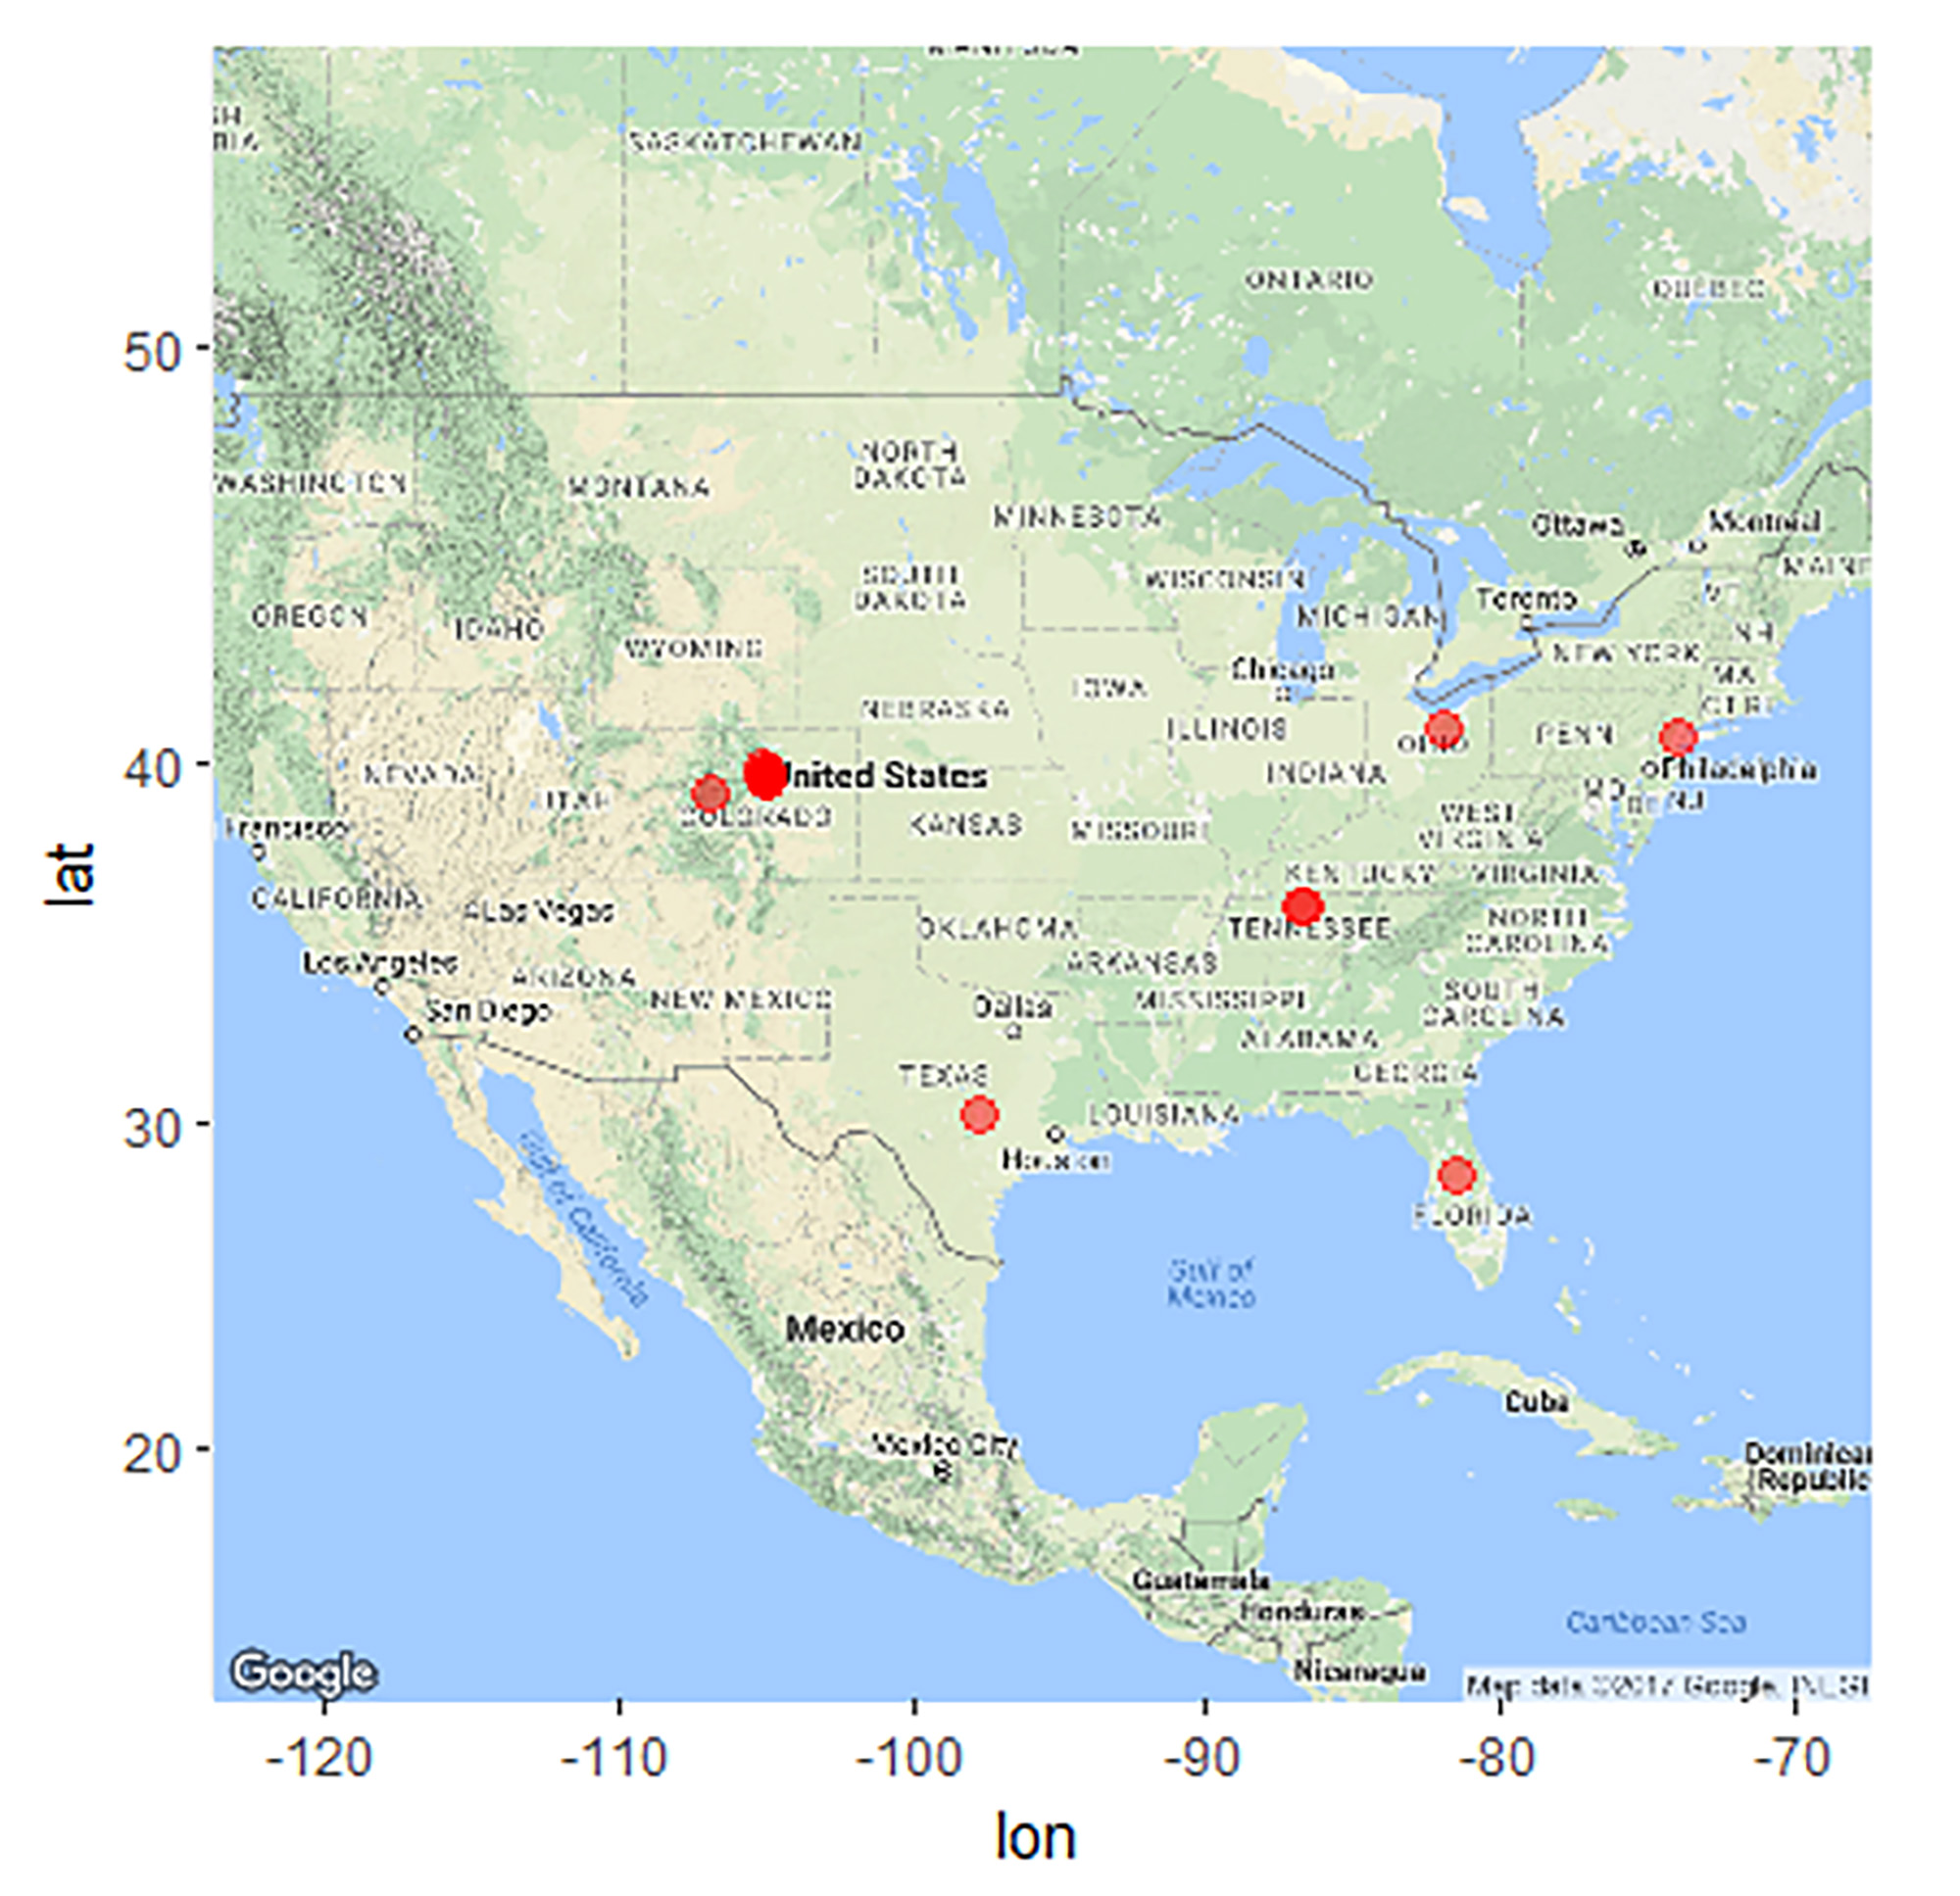
This plot shows the geographic information of tweets which shared their location. In this study, I only plot the users in the US as an example.
From this plot, we can see that the tweets which share geographic information with “beef” are mostly from the Midwest, such as Colorado, and there are some from the East Coast.
Though this plot only shows the tweets with geographic information provided, the beef industries can still know that the big beef markets are mostly in Midwest with some in the East Coast.
Figure 3: Big Beef Market Locations in the U.S.
Word counts
From the results, we know that popular words among beef tweets are “recipe” and “delicious”, which implies that when people talk about beef, most of time they care about “how delicious”.
Figure 4: Popular Words Word Cloud
Real-time shine app
For marketing value, retrieving real-time data is critical because companies have to make business decisions based on what is happening right now, not based on past data or experience.
In this study, I created a shiny app linked with real-time data so people can have fresh results.
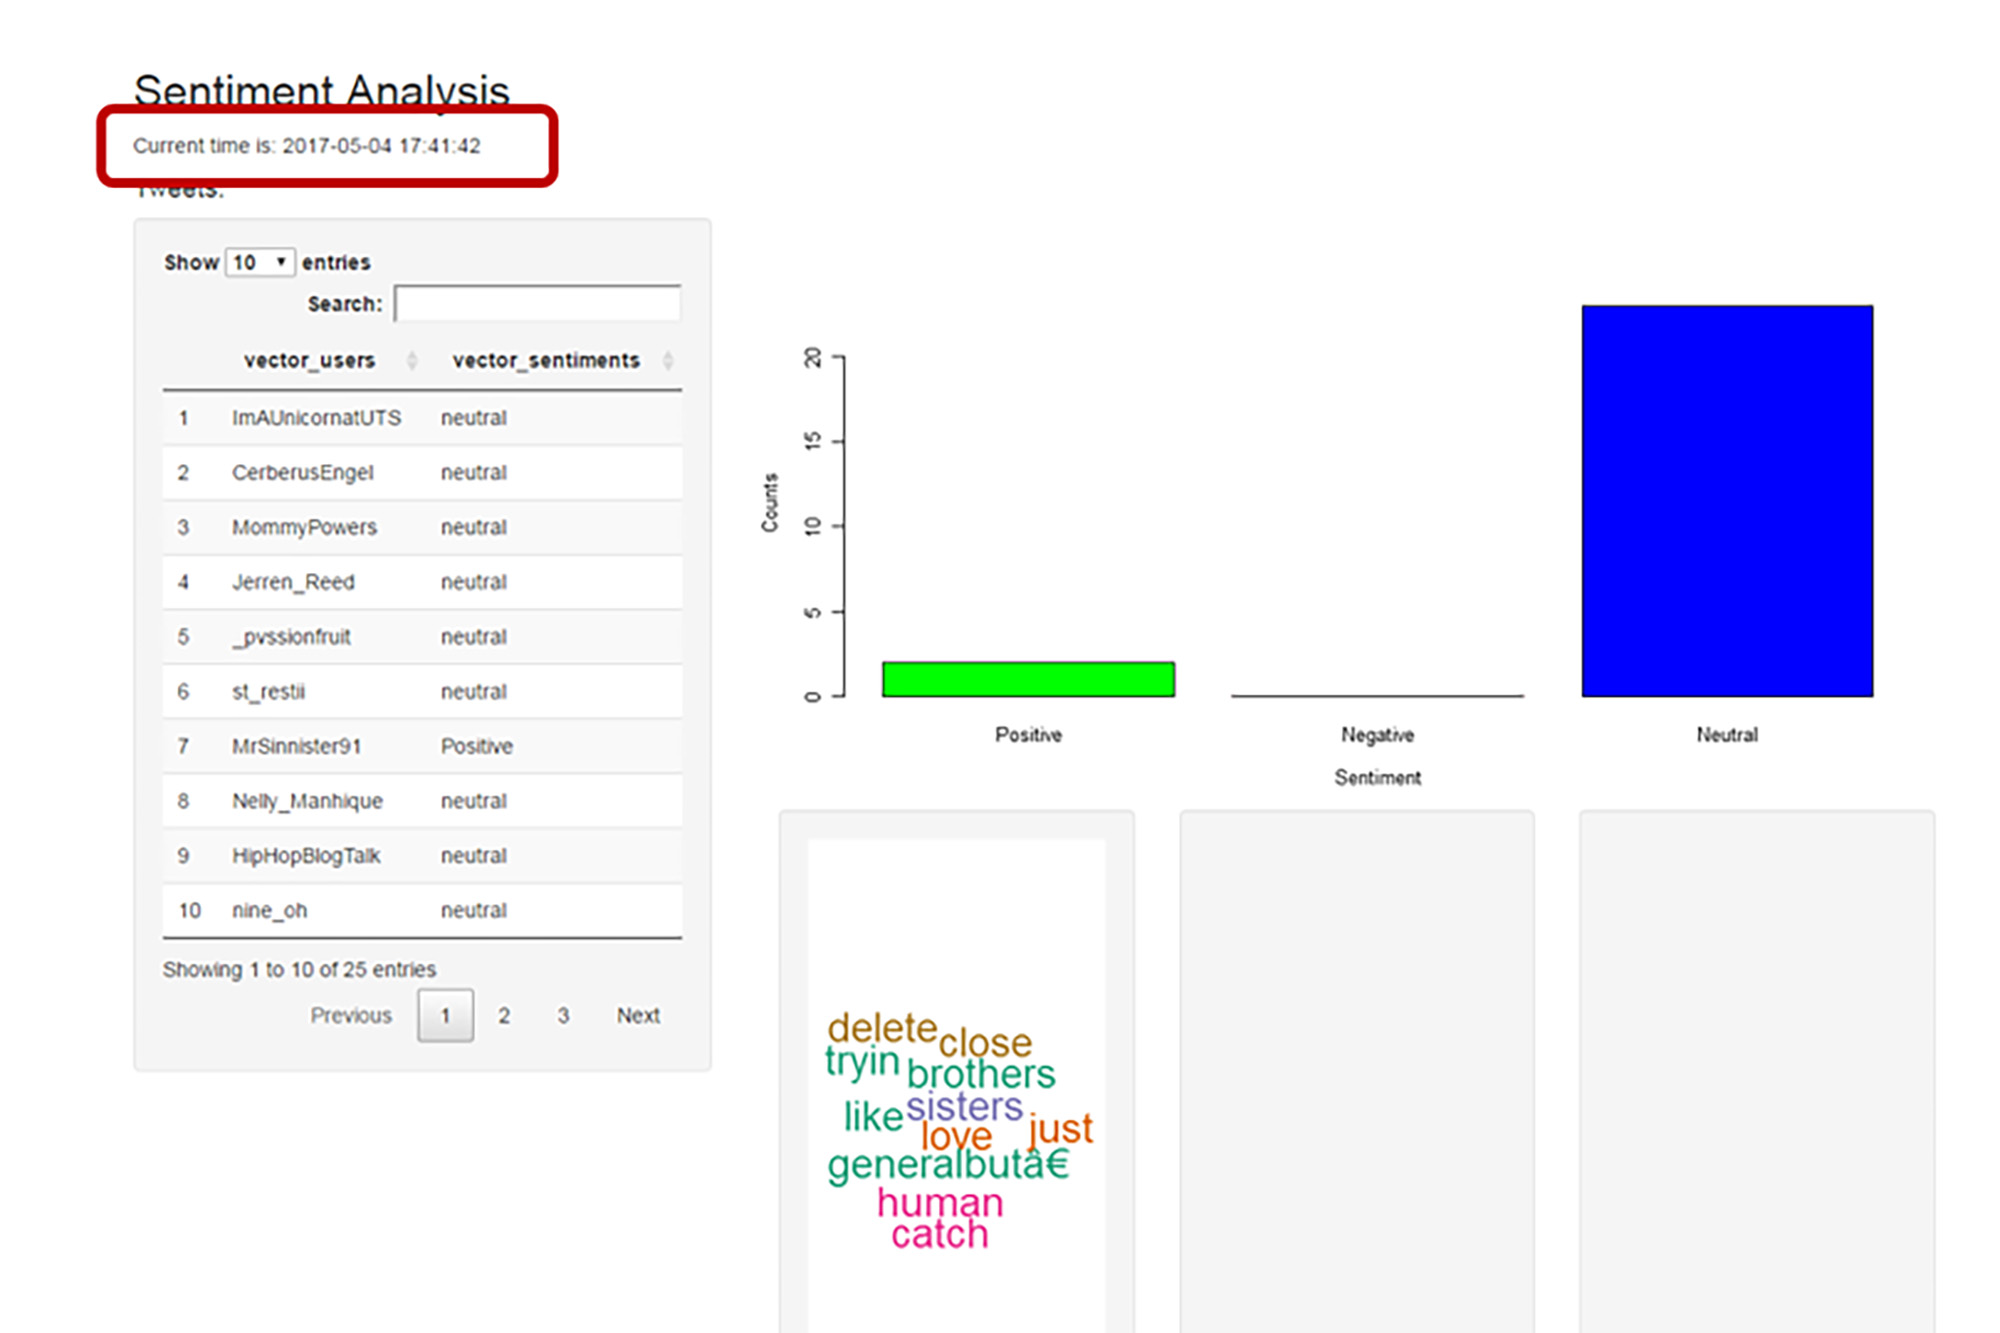
In this app, the tweets would be automatically updated every 10 seconds and all data are characterized into negative, positive or neutral. Under each category, I built a word cloud to demonstrate the popular words. Note, sometimes the word cloud is too big to demonstrate in the neutral category. Every 10 seconds the output is automatically updated.
Figure 5: Sentiment Analysis at Time 1
Figure 6: Sentiment Analysis at Time 2
Discussion
Big data techniques have been widely used in sentiment analysis fields. This is due to the nature of Twitter or other social media data on which people post real-time messages about their opinions on a variety of topics, discuss current issues, complain, and express positive sentiment for products they use in their daily life. Many companies who manufacture the products have begun to retrieve the online data to get a general sense of public sentiment. Doing sentiment analysis on Twitter data is a common field in big data research since these kinds of studies involve three V’s:
- Volume: millions of Twitter data online and the amount of Twitter data is still growing
- Velocity: business need real-time data to get real-time results
- Variety: Twitter data can come from everywhere and cover various of topics
One main challenge in business is to build technology to detect and summarize an overall sentiment with certain topics. In this final project, I mainly studied the sentiment analysis with multiple machine learning methods and compared the accuracy of each method with sample data. Then, I set the keyword “beef” for sentiment analysis. Considering certain words such as “juicy” implies a positive expression while other words such as “taste bad” indicate negative expression, I manually set some words with this topic as positive or negative seeds and then I used pattern match to characterize the Twitter data. So in this way, the beef business can quickly get the results and create business value using my project.
In future studies, building more models for classifying Twitter data might be a popular topic. Also, how to do analyses on emojis and build them into an emotion dictionary might be a good way to improve the sentiment analysis of Twitter data.
References
[1]. Apoorv Agarwal, Boyi Xie, Ilia Vovsha, Owen Rambow and Rebecca Passonneau (2011). Sentiment Analysis of Twitter Data. Proceedings of the Workshop on Language in Social Media (LSM 2011), pages 30–38.
[2]. Ramnath Balasubramanyan, William W. Cohen (2011). Sentiment Analysis of Twitter Data. Proceedings of the Workshop on Language in Social Media (LSM 2011), pages 12-19.
About the Author
Jiena G. McLellan is the project coordinator of the Beef Cattle Institute (K-State Vet Med). Originally from the Guangdong Province in China, she came to K-State with a degree in bioengineering. She received her master’s degree in statistics from Kansas State University after she finished her Graduate Certificate in Public Health. She is interested in storytelling with big data by using various tools such as data visualization and applied statistics. Her expertise is in big data analytics, applied statistics and create interactive applications with automatic reporting system. She may be reached at jiena@vet.k-state.edu.
| Previous page on path | Issue Navigation, page 8 of 26 | Next page on path |
Discussion of "Sentiment Analysis of Real-Time Twitter Data"
PlayeR Website
Jiena Gu McLellan has made an online app to help those who are just starting out in R to learn some basics. This is a highly interactive resource and is available at https://appforiarteam.shinyapps.io/PlayR/#section-about.Posted on 31 August 2018, 10:09 pm by Shalin Hai-Jew | Permalink
Author Profession Web Site
Jiena Gu McLellan has a new personal web page showcasing her professional and educational interests and achievements. This may be accessed at https://www.jienamclellan.com/.Posted on 11 September 2018, 2:36 pm by Shalin Hai-Jew | Permalink
Add your voice to this discussion.
Checking your signed in status ...