Conducting a Cross Tabulation Analysis in the Qualtrics Research Suite
By Shalin Hai-Jew, Kansas State University
It used to be that online survey tools enabled the rich capture of respondent data and then enabled researchers to download the data for analysis in other tools. While that workflow is still valid for many cases, many online survey systems have become their own “research suites” and enable data analytics, data visualizations, auto-created data dashboards, and report creation.
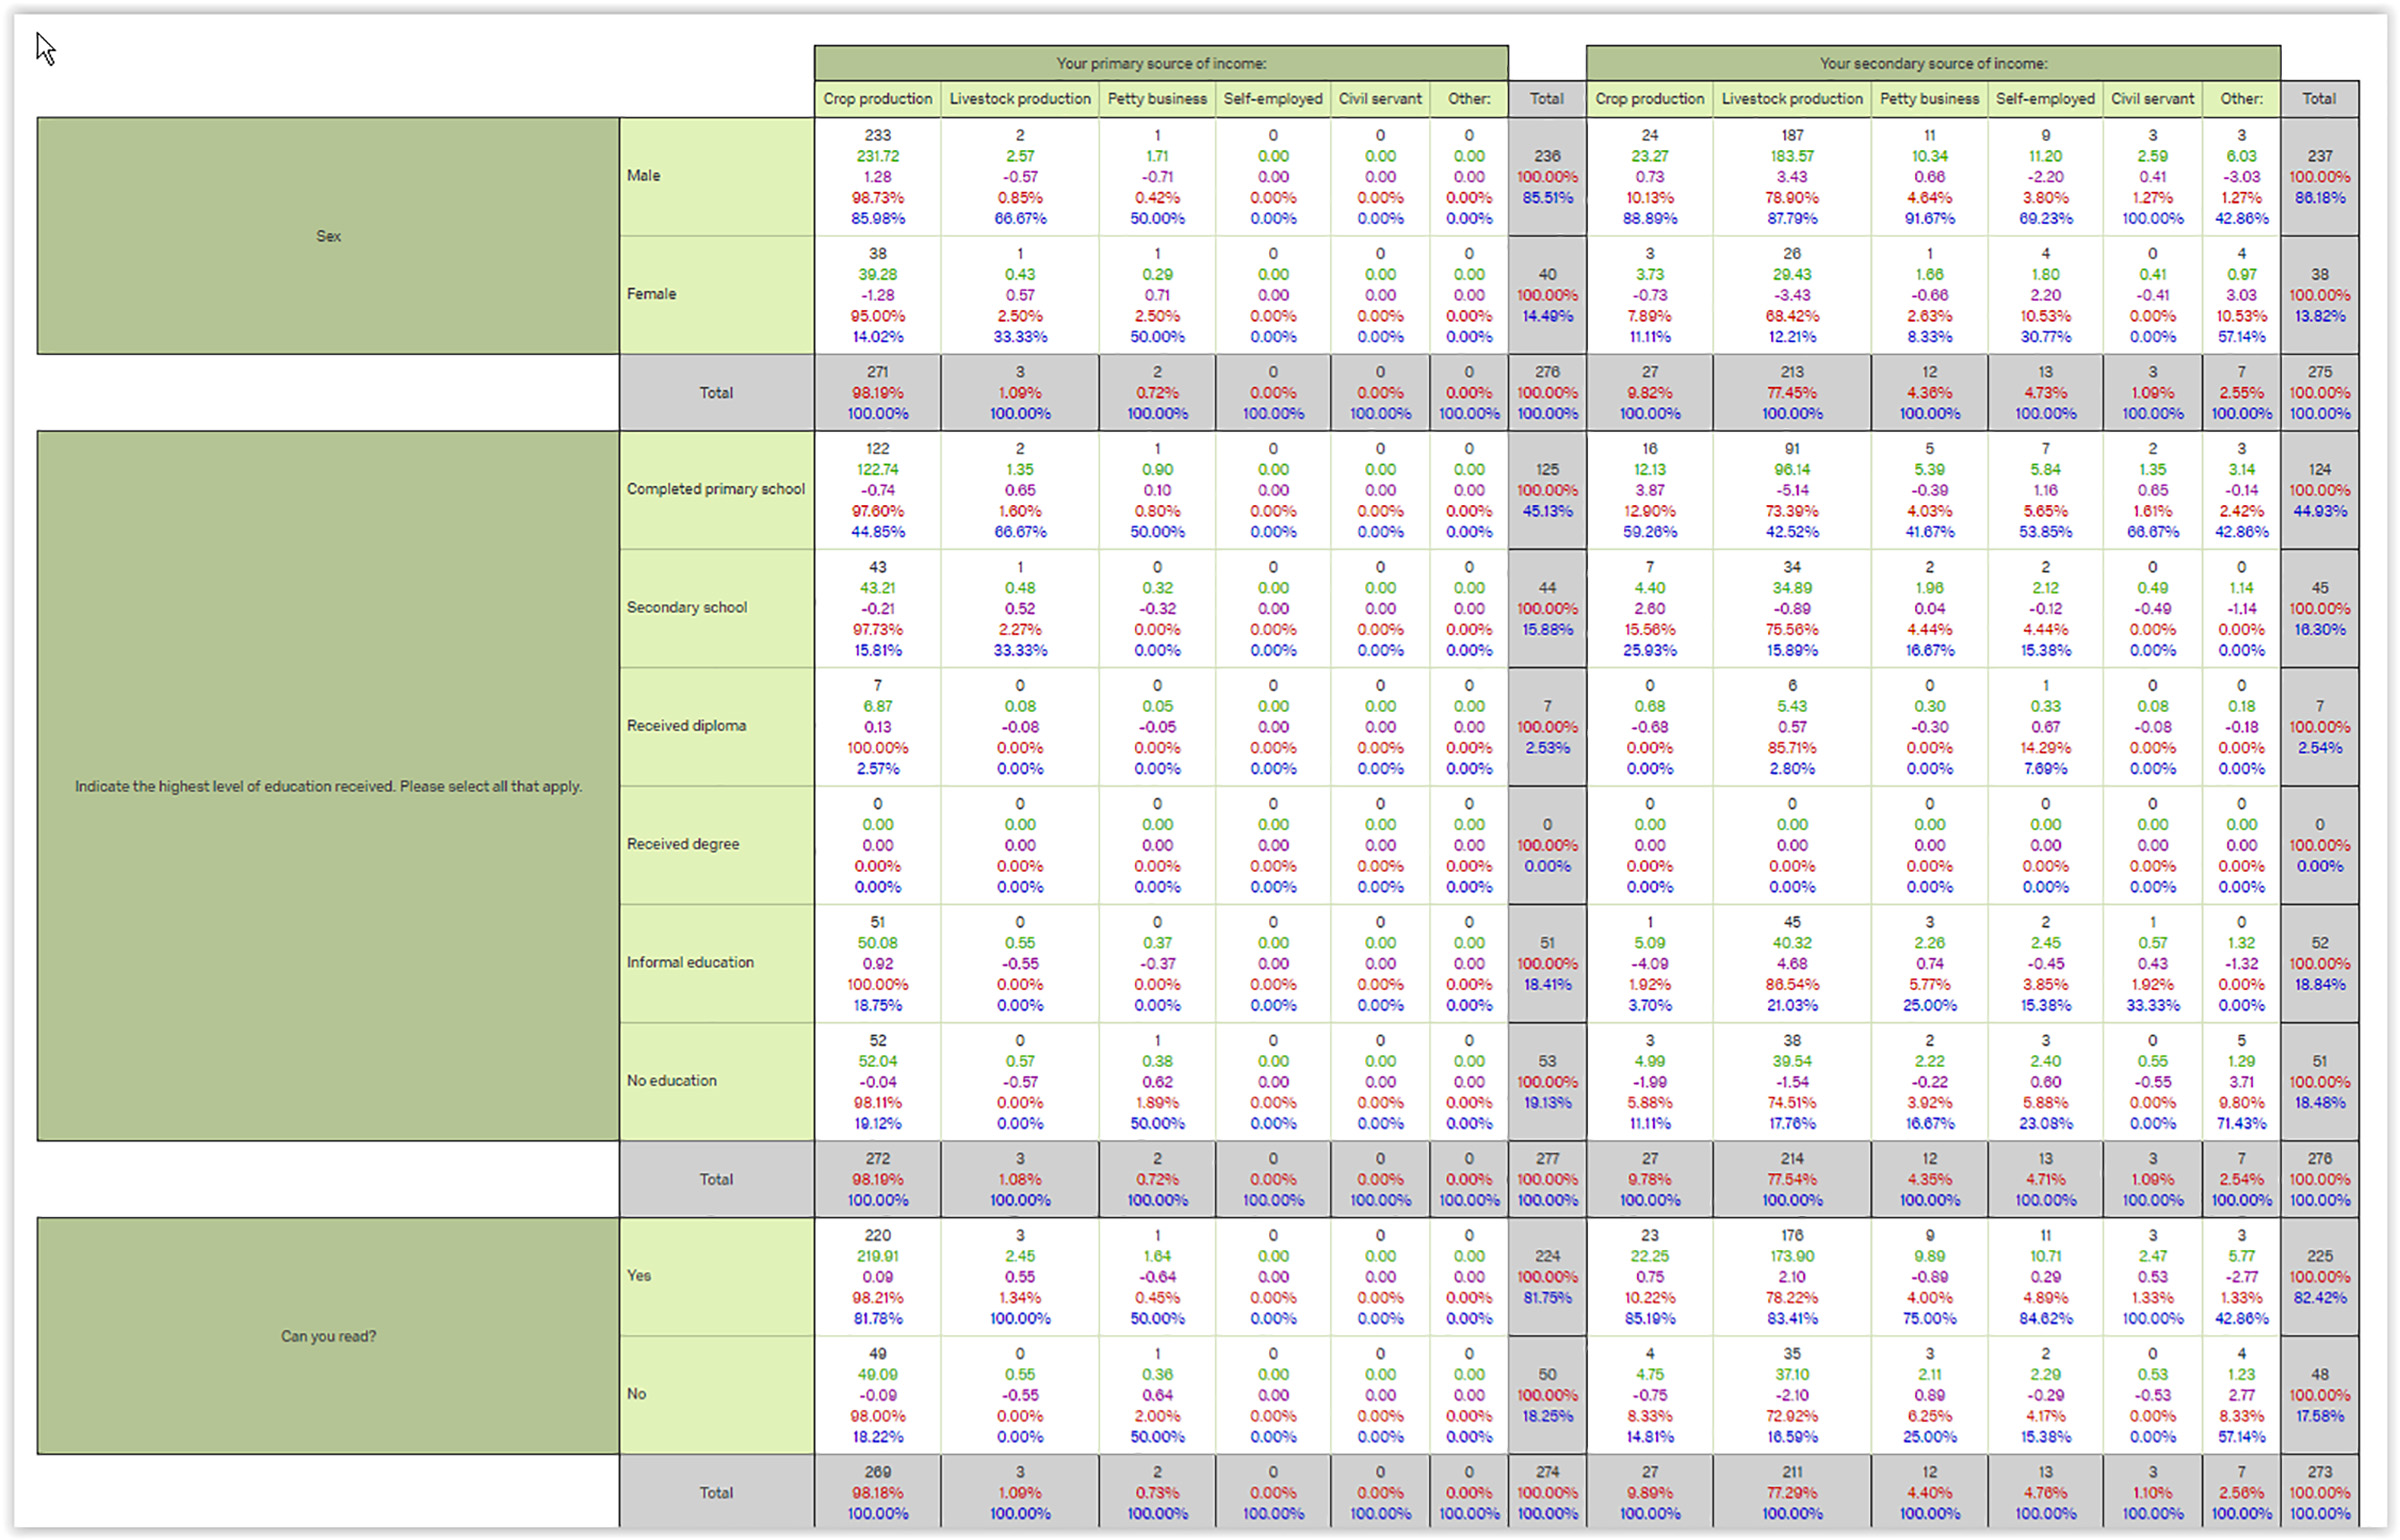
Figure 1: A Cross Tabulation Table with Attribute Values as Variables
One of the data analytics methods built into the Qualtrics Research Suite is a cross tabulation analysis, a common tool used with categorical (or nominal) and “non-parametric” data. The computational cross tabulation enables the identification of patterns in survey question responses that might well remain latent otherwise…at computer speeds…and with big(ger) data. (The limits of “big data” analytics are not fully clear since Qualtrics is a cloud-based tool and may be hosted on servers with large-scale processing capabilities, but processing may be limited based on the user account types.) This article introduces some features of this cross tabulation in Qualtrics.
A Generic Cross Tabulation Analysis
A cross tabulation table (also known as a “contingency table”) basically captures the frequency distribution of multiple variables and their interrelations (if any). This approach was first described by Karl Pearson in 1904 (“Contingency table,” July 6, 2016).
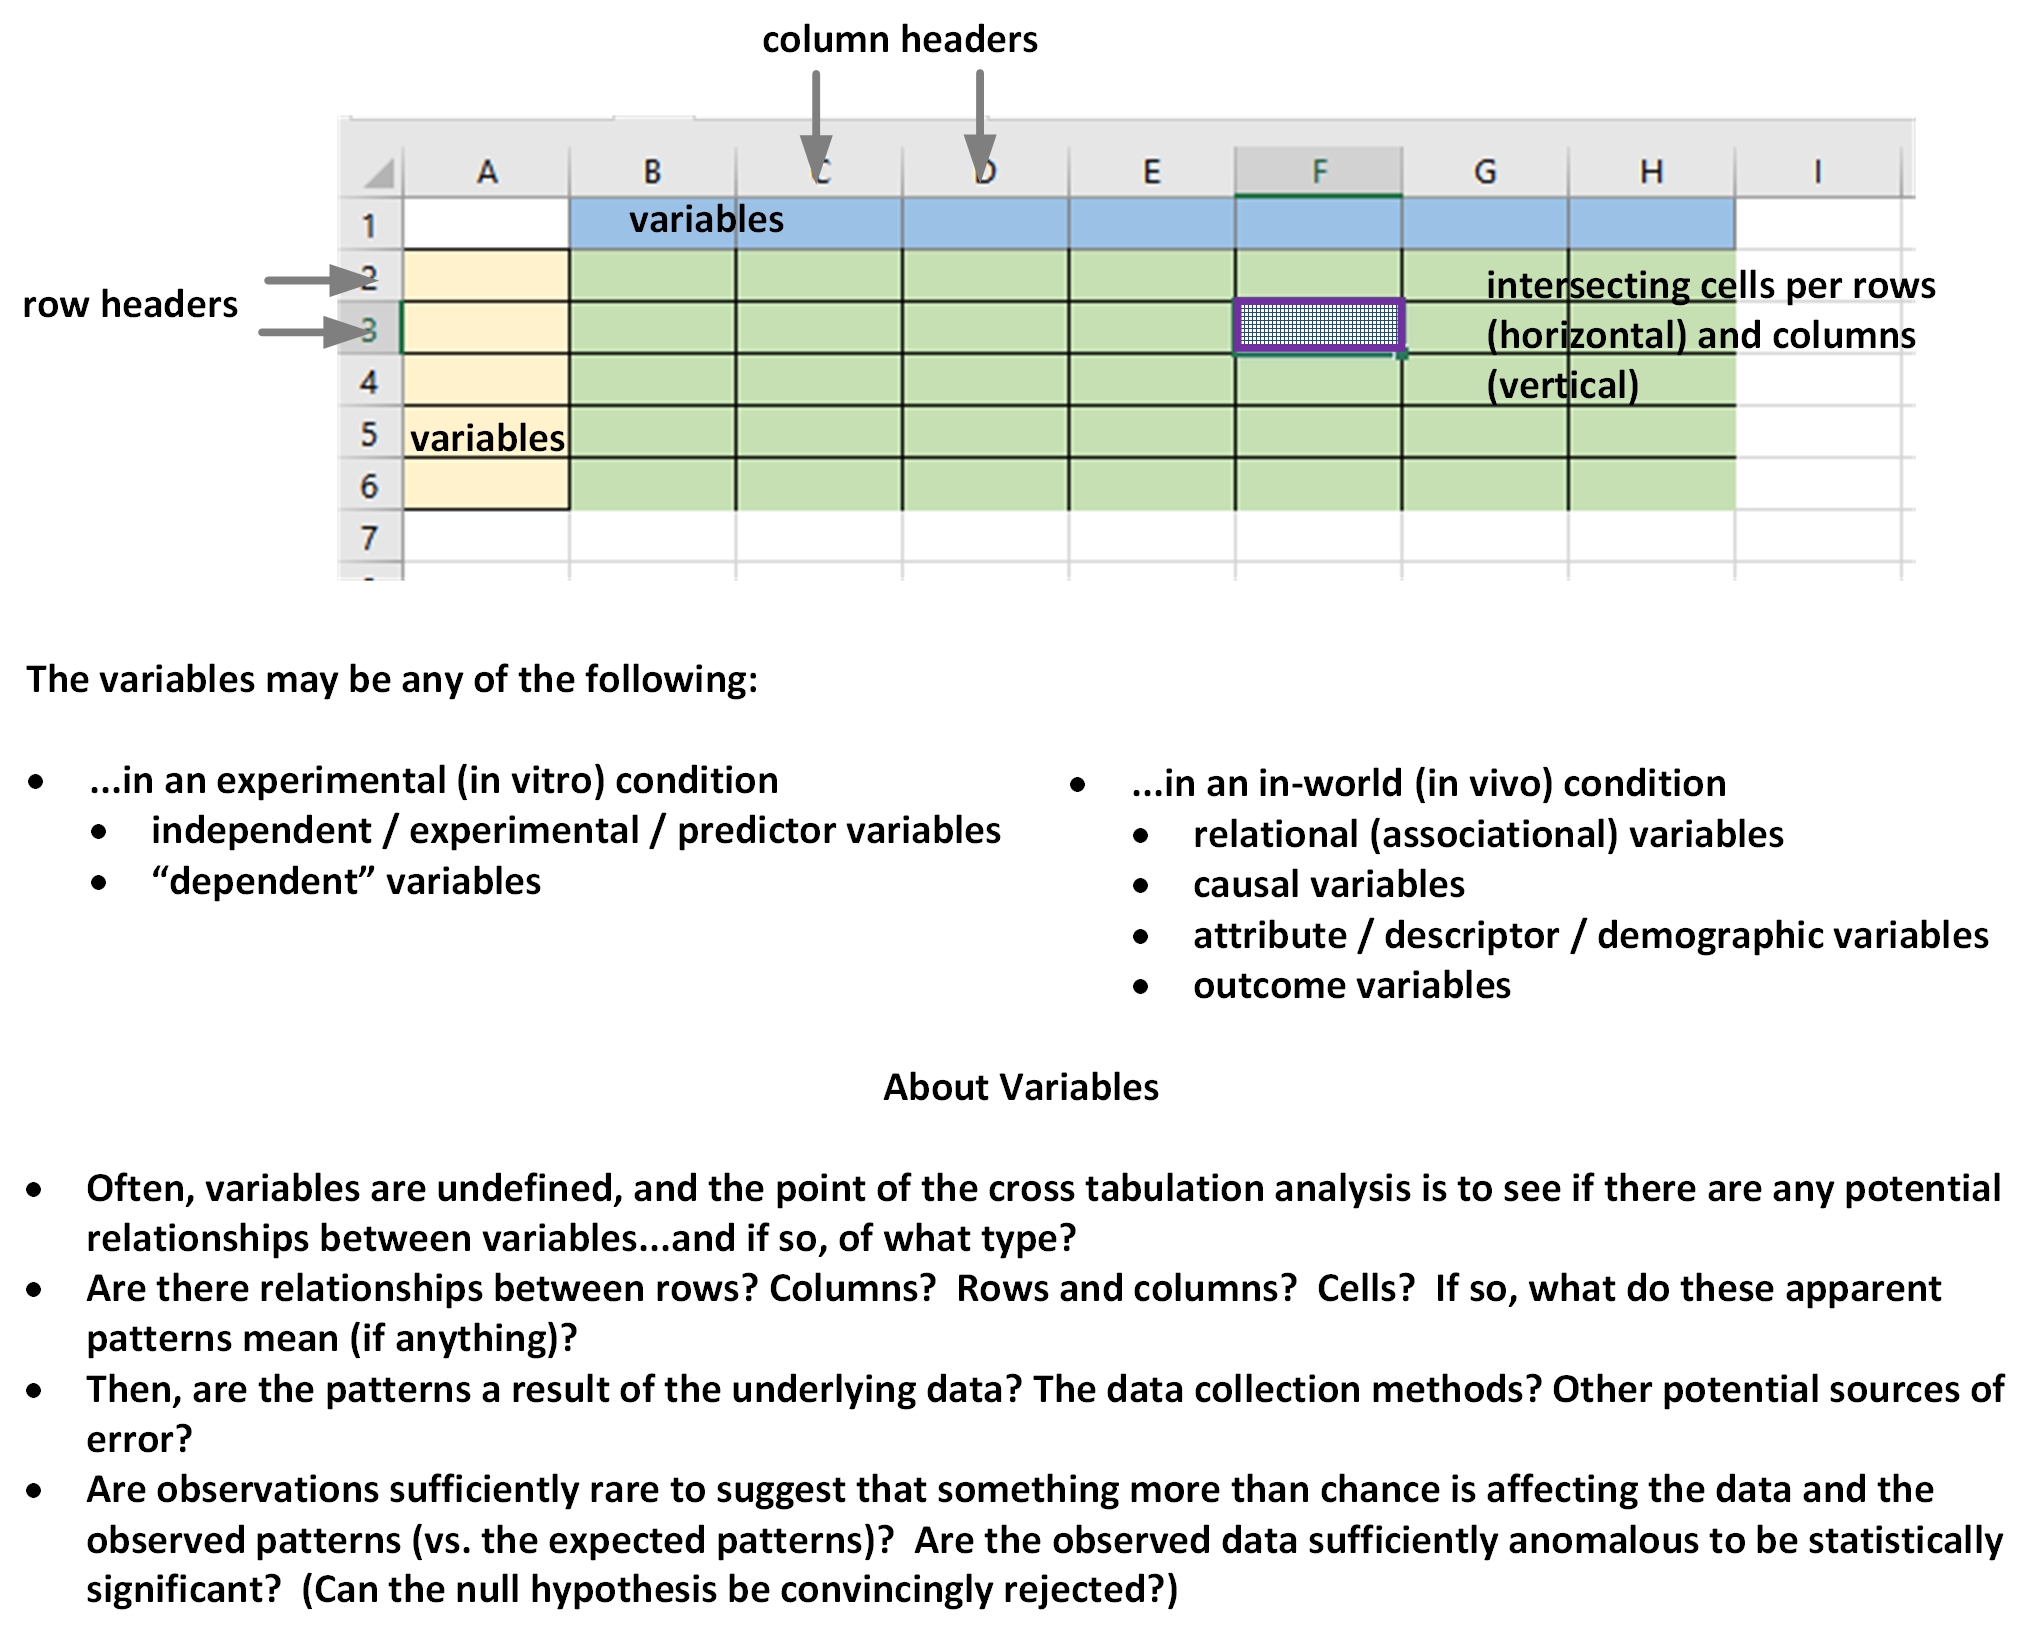
So what are the basic elements of a cross tabulation data table (Figure 2)? Essentially, across the column headers and down the side of row headers are various types of variables. The intersecting cells (reading across from the row and down from the selected column) show the tabulation or counts of the occurrences of both variables.
Binary (or dichotomous) cell data. Some cross tabulation results in a matrix with cells that are only 1s and 0s, with 1s representing the presence of a relationship and 0s representing the absence of a relationship. This binary result is a common type of matrix. (If both the column and row headers are the same entities—so {B1-H1} = {2A-8A}, then a relational graph may be drawn from the data with just the binary results indicating whether a relationship exists or not between each variable.) It can also be that for the particular table, there are only two types of responses possible, like a positive or negative sentiment rating.
Frequency cell data. Another sort of cross tabulation table contains cells with frequency data. What is in these cells are numbers that show specific counts of the intersecting rows and columns. The results are often depicted as intensity matrices (with darker and more saturated color in cells that have proportionally higher counts).
Content cell data. In some cross tabulation analyses, the cell data may be textual contents. For example, when cross tabulations are of coded nodes (such as in a qualitative data analytics tool), the intersected cells contain text that were coded to both nodes (in an overlapping way).
Variables in rows or columns? The variables themselves may be put in either the rows or the columns (such tables can be transposed easily), but there is usually a method to their selection, in order to identify particular patterns in the underlying data. Sometimes researchers will run very large cross tabulation analyses in order to find particular variable relationships, which they will then depict in much smaller and targeted cross tabulation data tables for visual coherence in presentation.
Figure 2: Basic Elements of a Cross Tabulation Table
Figure 2 gives a small sense of some of the analytical dependencies for a cross tabulation analysis. It is important to know how the research was conducted to acquire the underlying variable data and how solid those data are. How were the variables selected is important? As noted in the figure, observed nominal data may come from experimental conditions or in-world non-experimental ones. The variables in the first context by be predictor variables and dependent variables. In in-world observations, the variables may be of various types. Attribute variables describe features of respondents, such as demographic data, which enables grouping of respondents to see if there are patterns of survey responses among respondent groups. Outcome variables show fixed in-world realities that may be used to categorize respondents into groups to see if there are patterns. Generic variables may have associational relationships with other variables...or even apparent causal relationships. The interpretation of such variable relationships may be informed in part by theory but also by empirical observations and by abductive logic.
What was seen in the data? What was not seen? How astutely did a researcher or research team analyze the respective cells, across cells, across columns, across rows, and through the cross tabulation tables (yes, plural) matters. What computational aids were used to extract patterns? How the researcher(s) hypothesized around the cross tabulation table is central to a successful analysis? How nuanced is the analysis, and how clearly explained are the outcomes?
Cross tabulation analyses are not just conducted to create finalized data summaries. These may be run during the data exploration stage of research work to see if there may be data query leads to pursue.
This analytical approach may not necessarily result in reportable findings. There may not be any support for hypothesized associations or relationships between variables. The variables themselves may be unrelated or even independent (based on the frequency counts). Maybe some variables have only very nuanced or mild associations, and worse, maybe the collected data itself is insufficient to capture an actual real effect. [Even with categorical data and a fairly low “n,” there is an understanding that there has to be sufficient data to avoid Type 1 (false positives) and Type 2 (false negatives) errors. Type 1 errors involve rejection of a true null hypothesis when the null hypothesis is true (thinking that an effect is there when it isn’t); Type 2 errors involve rejection of a true hypothesis even when the null hypothesis should be rejected (thinking that an effect is not there when in fact it is). If the research is sufficient (enough data points), in theory, there will be mostly true positives and true negatives.] Even if results are relevant, sometimes these analyses only result in a publishable sentence or paragraph; occasionally, these may merit a data visualization.
In an Online Survey
While many may not have heard of cross tabulation analyses, this analytical approach is quite common: “One estimate is that single variable frequency analysis and cross-tabulation analysis account for more than 90% of all research analyses” (“Cross Tabulation Analysis,” 2013), according to the Qualtrics site. The ease of applying this approach computationally to survey results is a fairly new innovation. (In Figure 3, Qualtrics powers the K-State Survey system.)
Figure 3: Qualtrics Landing Page at Kansas State University
Effective question design. The rules to designing effective and non-biased surveys involve plenty of skill but are beyond the purview of this article. For practical purposes, assuming that a survey itself is correctly designed, there are some additional considerations so that the resulting data may effectively analyzed and queried with cross tabulation tables.
Response types cannot be directly qualitative, such as through text-only or uploaded imagery or video or audio. A cross tabulation assumes that there is a frequency count in the response. What works then would be multiple choice questions (with a range of closed-answer questions which may be counted), true-false questions, demographic questions with defined selection categories, slider questions with measures of intensity, Likert-scaled questions with intensity responses, and so on. Text-based question results may be quantized using text frequency analyses, but these would have to be exported and analyzed outside Qualtrics (at least at this time). Multimedia responses, such as digital imagery, video, and audio responses (through the file upload feature), would have to be manually analyzed and coded for learning value, again, outside of Qualtrics.
Another important aspect is to ensure each question (or response elicitation) is only single-barreled. A double-barreled or multi-aspect question will muddle the data results. Multi-collinearity in the designed variables (respective survey questions) may be used to double-check results, but will add redundancy to the survey. If there are questions that were not included in the survey, then some aspect of the potential data will not be usable in a cross tabulation analysis (or else, that question will have to be asked differently using other data).
Cleaning data for cross tabulation analysis? There is not an actual equivalent approach to pre-processing and cleaning data before it is run through a cross tabulation analysis. Certainly, the data from Qualtrics may be exported in filtered reports that will enable data cleaning in external tools, but within Qualtrics, there is not an obvious way to clean the data online. This is another reason why proper question design is important early on.
If there are problematic response entries (such as spam ones), it is possible to delete a response within Qualtrics and decrement any quota counts.
Chi-Squared Statistics (χ2)
With some types of cross tabulation analyses, it may be relevant to run chi-square (or “chi-squared”) statistics. Essentially, this statistic extends the power of a cross tabulation data table beyond basic counting by enabling a feature of quantitative data analytics: the ability to “reject the null hypothesis.” What that phrase means is that a researcher can with a certain level of confidence suggest that the data he or she is observing is likely not just due to random chance but is a result of some potential causal or associational factor (with α alpha values of p < .05, or an even higher standard of p < .01).
In this case, based on categorical data, the baseline is not set on any normal curve, but the baseline is set on “expected frequency values” (a statistically derived assumed distribution) in a particular cell as compared to “observed frequency values.” The expected frequency values are based on the known underlying classes and what researchers would expect to see in terms of data values based on those classes. This is a form of "bootstrapping," in which an underlying data distribution is empirically derived (albeit based not on collected data but expected frequencies derived statistically). ["Bootstrapping" refers to the use of whatever existing resources one has to achieve a particular aim in an environment of scarcity or challenge.]
The chi-square equation reads as follows:
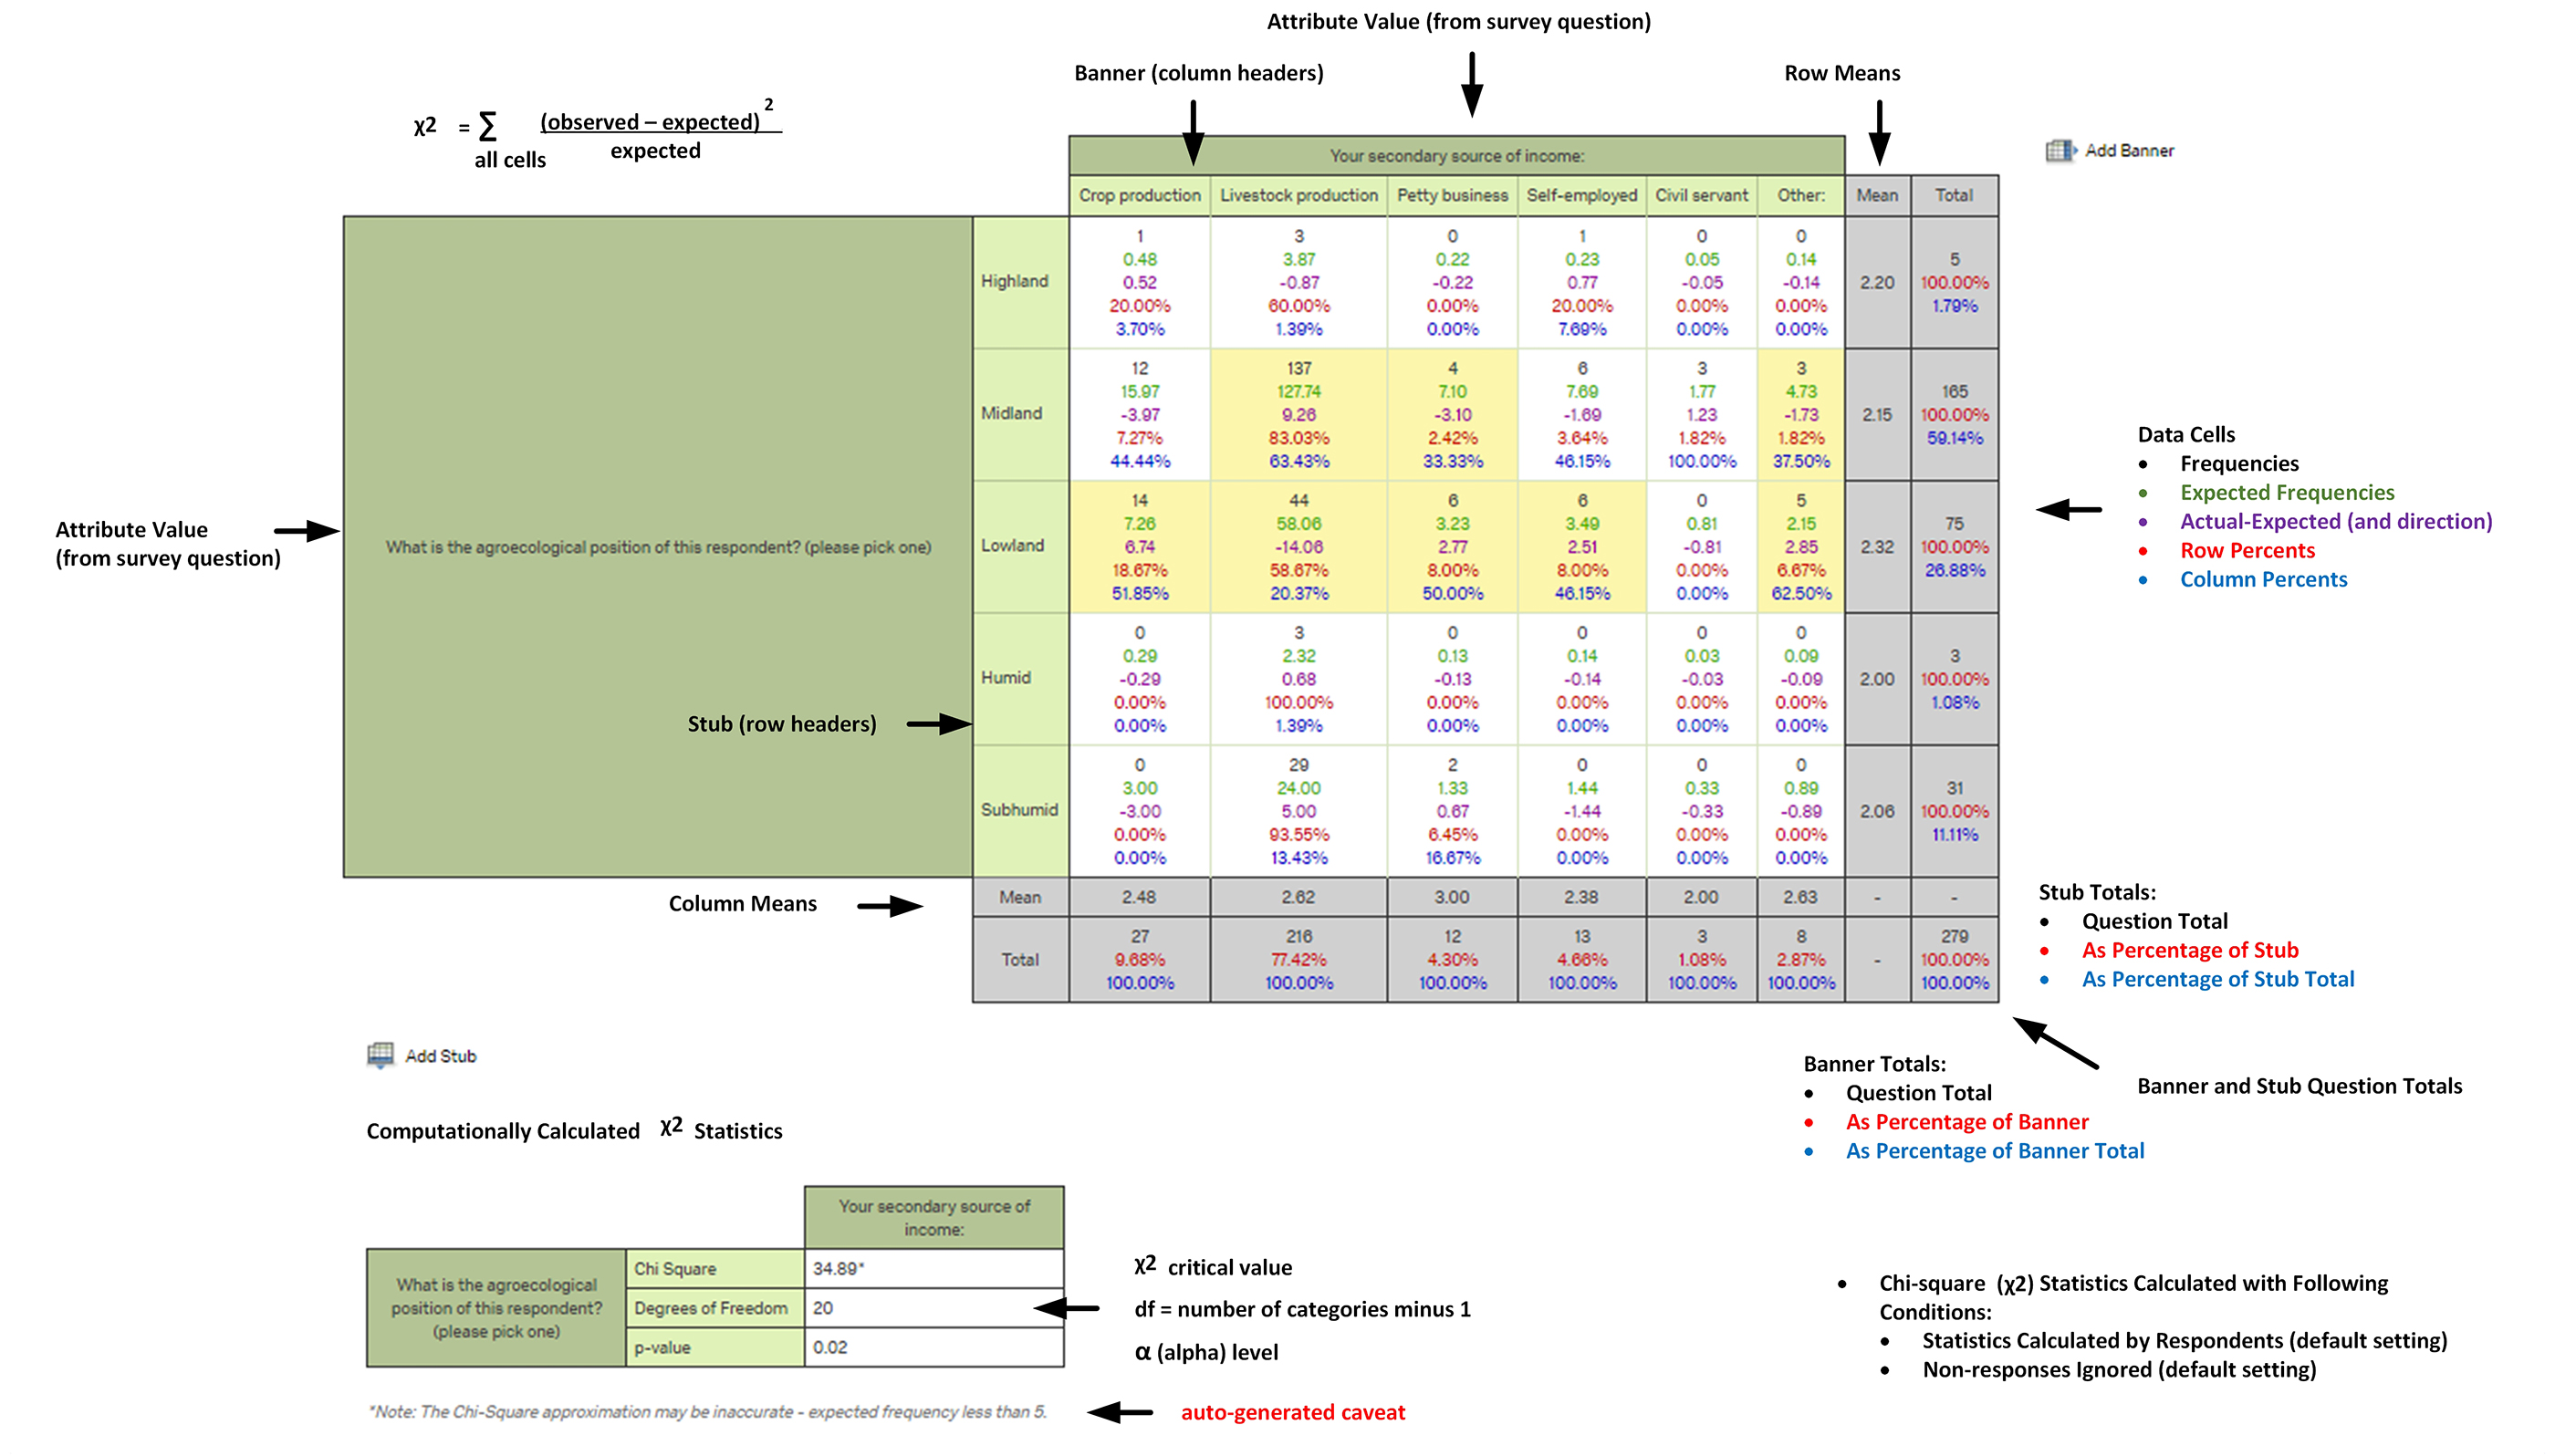
χ 2 = ∑ (o-e) 2
e
or chi-squared equals the sum over all cells where the expected value (e) is subtracted from the observed value (o) and then squared (to capture the difference between the observed frequency value from the expected frequency value, whether the first amount is larger or smaller than the expected frequency value), divided by the expected value. The squaring ensures that the difference from the expected value is rendered as a positive number whether the difference is a positive or a negative number.
If the observed data follows theorized expected distribution (created from the expected values)--whether it skews left or right or is bimodal or has other expected frequency curve features--then it may be assumed that the null hypothesis cannot be legitimately rejected (so the assumption is that only random chance is influencing the variance in the observed data).
If the observed frequency data is sufficiently anomalous, the chi-square value has to be higher than what would be expected on a Chi-Square Distribution Table. This table basically calculates the critical chi-square value based on the degrees of freedom or “df” (the number of possible outcomes in the cross tabulation minus 1) and the alpha level (or p-value). If a calculated χ 2 value is higher than the critical value in the table, there is a sufficient confidence that the null hypothesis may be rejected (usually at levels of 95% or 99% confidence). If it fails to exceed the critical value, then the findings are insufficient to reject the null hypothesis (“There is no significant statistical difference between the observed and expected frequencies of this categorical data”).
In Qualtrics, the Chi-Square Distribution Table does not directly have to be referred to because the alpha level is automatically calculated. Further, the resulting table itself can be layered over with additional summary statistics (Figure 4).
Figure 4: An Example of a Cross Tabulation Analysis from Qualtrics (with Chi-Square Statistics)
While the chi-square statistic requires at least a context of two possible outcomes or one degree of freedom, a cross tabulation analysis requires at least a two-dimensional table but can include a wide range of dimensions.
While this chi-square test can inform researchers about whether they may reject the null hypothesis with confidence or not, the analysis does not stop here. The chi-square test may suggest that observed data is sufficiently out-of-norm to be statistically significant, which suggests that something more than chance is affecting the observed frequencies. The nature of the apparent association between defined variables is not spelled out by this test. The interpretation of the findings may be better informed by the researcher’s expertise. Part of expertise involves the deft use of language to explain the findings, so as not to over-claim or under-claim or otherwise miss out on what may legitimately be assertable.
Cross Tabulation Analysis in Qualtrics
So how does a researcher create a cross tabulation analysis using Qualtrics?
Basic Steps to Starting a Cross Tabulation Analysis Using Qualtrics
- Log into the Qualtrics Research Suite survey site.
- Navigate to the target survey.
- Click the “Data & Analysis” tab.
- In the ribbon, select “Cross Tabs.”
- Click the green “+ Create a new Cross Tabulation” button at the top left.
- In the left columns of checkboxes, select the desired Banner elements (column headers).
- In the left columns of checkboxes, select the desired Stub elements (row headers)
- At the bottom right, click “Create Cross Tabulation.” The Cross Tabulation table appears, and the chi-square statistics appear below the main table.
- To add elaboratory cell information, an additional step is needed. In the Data Options dropdown menu, select the following: Expected Frequencies, Actual – Expected, Row Percents, Column Percents, Show Banner Means, and Show Stub Means.
- To change the default name of the cross tabulation analysis (which is an automated concatenation of the survey name and “Cross Tabulation”), click on the name at the top left.
- Click on the Custom Highlights button at the top, and manually highlight the cells which show relevant patterning.
There are tools to enhance researcher interactivity with the data. There is a Row/Column Selector to enable homing in on a particular cell and results in the highlighting of the entire row and column. A “Puller” tool enables navigating around a particularly large cross tabulation table by enabling the pulling of a table up and down, and side-to-side, as needed.
To change up the data, additional banners and stub elements may be added on the fly. At the banner and stub levels, users may “Add Multilevel Drill Down” features to the data for more complex dimensionality. Additional question elements may be brought into play to add nuance to the cross-tab analysis. The existing data may be filtered (by question responses, by embedded data) and the cross tabulation table re-calculated. Custom equations may be applied to respective banners and stubs for further complex analysis.
Under "Data Options" -> "Advanced Options," it is possible to change how the cross tabulation table handles the statistics, whether calculating statistics based on respondents or on responses. In the notes, it reads that statistics based on responses are calculated as follows: "Percentages and other stats are calculated based on the number of responses. (For multiple answer questions the number of responses may be greater than the numbr of respondents to that particular question. This method is not recommended.)" The default is set to the calculating of statistics based on respondents. Also, researchers may choose to "Ignore non-responses" (default), or they may choose to "Show non-responses," which would draw an additional column for each question with the number of survey respondents that skipped that question.
The color scheme applied to the cross tabulation table may be changed for a different look-and-feel.
Finally, the cross tabulation tables may be exported to Excel or PDF formats. In Excel format, the table data may be further analyzed in other data analytics tools. In the PDF format, the look-and-feel of the visualizations are captured and may be re-versioned into digital image format for presentation purposes.
Conclusion
This article touches on cross tabulation analysis in a general way and then showed how this classic analytics approach may be applied in Qualtrics, using responses to questions to identify statistically significant associations between survey responses (as variables). While this used an online survey as an example, there are many ways to use an online research suite--for
- online polling,
- electronic Delphi studies,
- large-scale trainings and related assessments,
- crowd-sourced sampling,
- and other types of research.
These approaches have their own underlying assumptions and data strengths / limitations. Even so, the cross tabulation analysis tool within Qualtrics may be used to identify empirical data patterns and create insights.
This article is meant to be a light introduction to the complexities of the Cross Tabs analytic tool in the Qualtrics Research Suite.
References
“Contingency Table.” (2016, July 6). Wikipedia. Retrieved July 9, 2016, from https://en.wikipedia.org/wiki/Contingency_table.
“Cross Tabulation Analysis.” (2013). Qualtrics site. Retrieved July 6, 2016, from https://www.qualtrics.com/wp-content/uploads/2013/05/Cross-Tabulation-Theory.pdf.
About the Author
Shalin Hai-Jew works as an instructional designer at Kansas State University. She has conducted data analyses using Qualtrics—on grant-funded projects. She has no official tie to Qualtrics. She may be reached at shalin@k-state.edu.
| Previous page on path | Issue Navigation, page 18 of 25 | Next page on path |
Discussion of "Conducting a Cross Tabulation Analysis in the Qualtrics Research Suite"
Add your voice to this discussion.
Checking your signed in status ...