By Shalin Hai-Jew, Kansas State University
Data visualizations are everywhere, and they are growing ever more complex as layers of information are integrated into them. One of my favorite data visualizations is the spider chart (aka “radar chart” or “star chart”). A spider chart is a two-dimensional diagram that consists of at least three axes fanning out from a mid-point. This chart usually comes with text labels, a name, and even a descriptive legend.
Essentially, a spider chart captures quantitative features of multivariate data related to a particular phenomenon or phenomena, with each axis a kind of measure, starting with 0 (or some other base number, including negative and positive ones) in the middle. Such a chart may be used in a descriptive way or a comparative way (as this example).
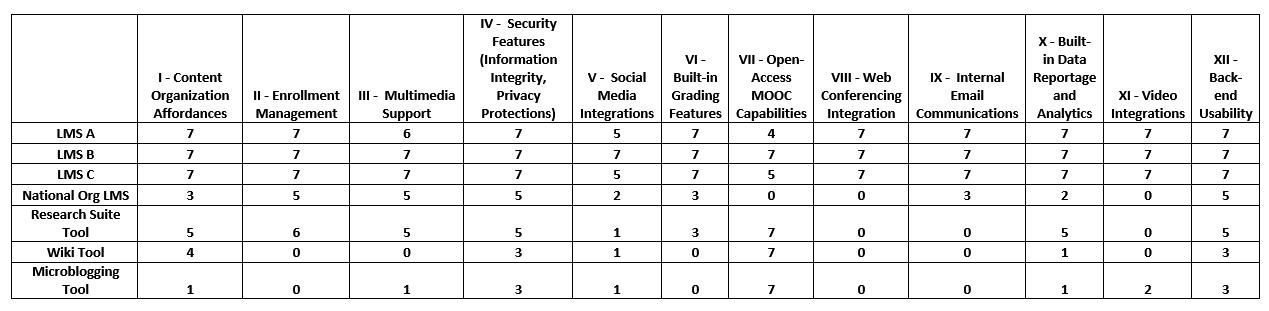
Building a spider chart may be done in order to help think through variables related to a particular phenomenon or phenomena. To show how this might work, I did a quick brainstorm about features of various technology systems used to deliver online learning. These are listed down the left column. While I had specific named learning management systems (LMS), a wiki, and other systems in mind during the brainstorm, I have since made the systems generic, so as not to cause offense (or liability). I brainstormed twelve variables (visible as column headers). To make these easier to reference, I used numbers to refer to them. There is no real actual sequence in the brainstorming of the dozen variables.
Figure 1: Underlying Table Data for the Spider Chart
Three LMSes, one national organization LMS, a research suite tool, a wiki tool, and a microblogging tool were assessed.
The variables were as follows:
I. Content Organization Affordances
II. Enrollment Management
IV. Security Features (Information Integrity, Privacy Protection)
V. Social Media Integrations
VI. Built-in Grading Features
VII. Open-Access MOOC Capabilities
VIII. Web Conferencing Integration
IX. Internal Email Communications
X. Built-in Data Reportage and Analytics
Generally, variables should be of-a-kind. They should generally be mutually exclusive. They should be single-barreled [#IV is multi-barreled in terms of the features in the parentheses (“information integrity,” “privacy protections”)…but at the more general level, it is single barreled (“security features”)].
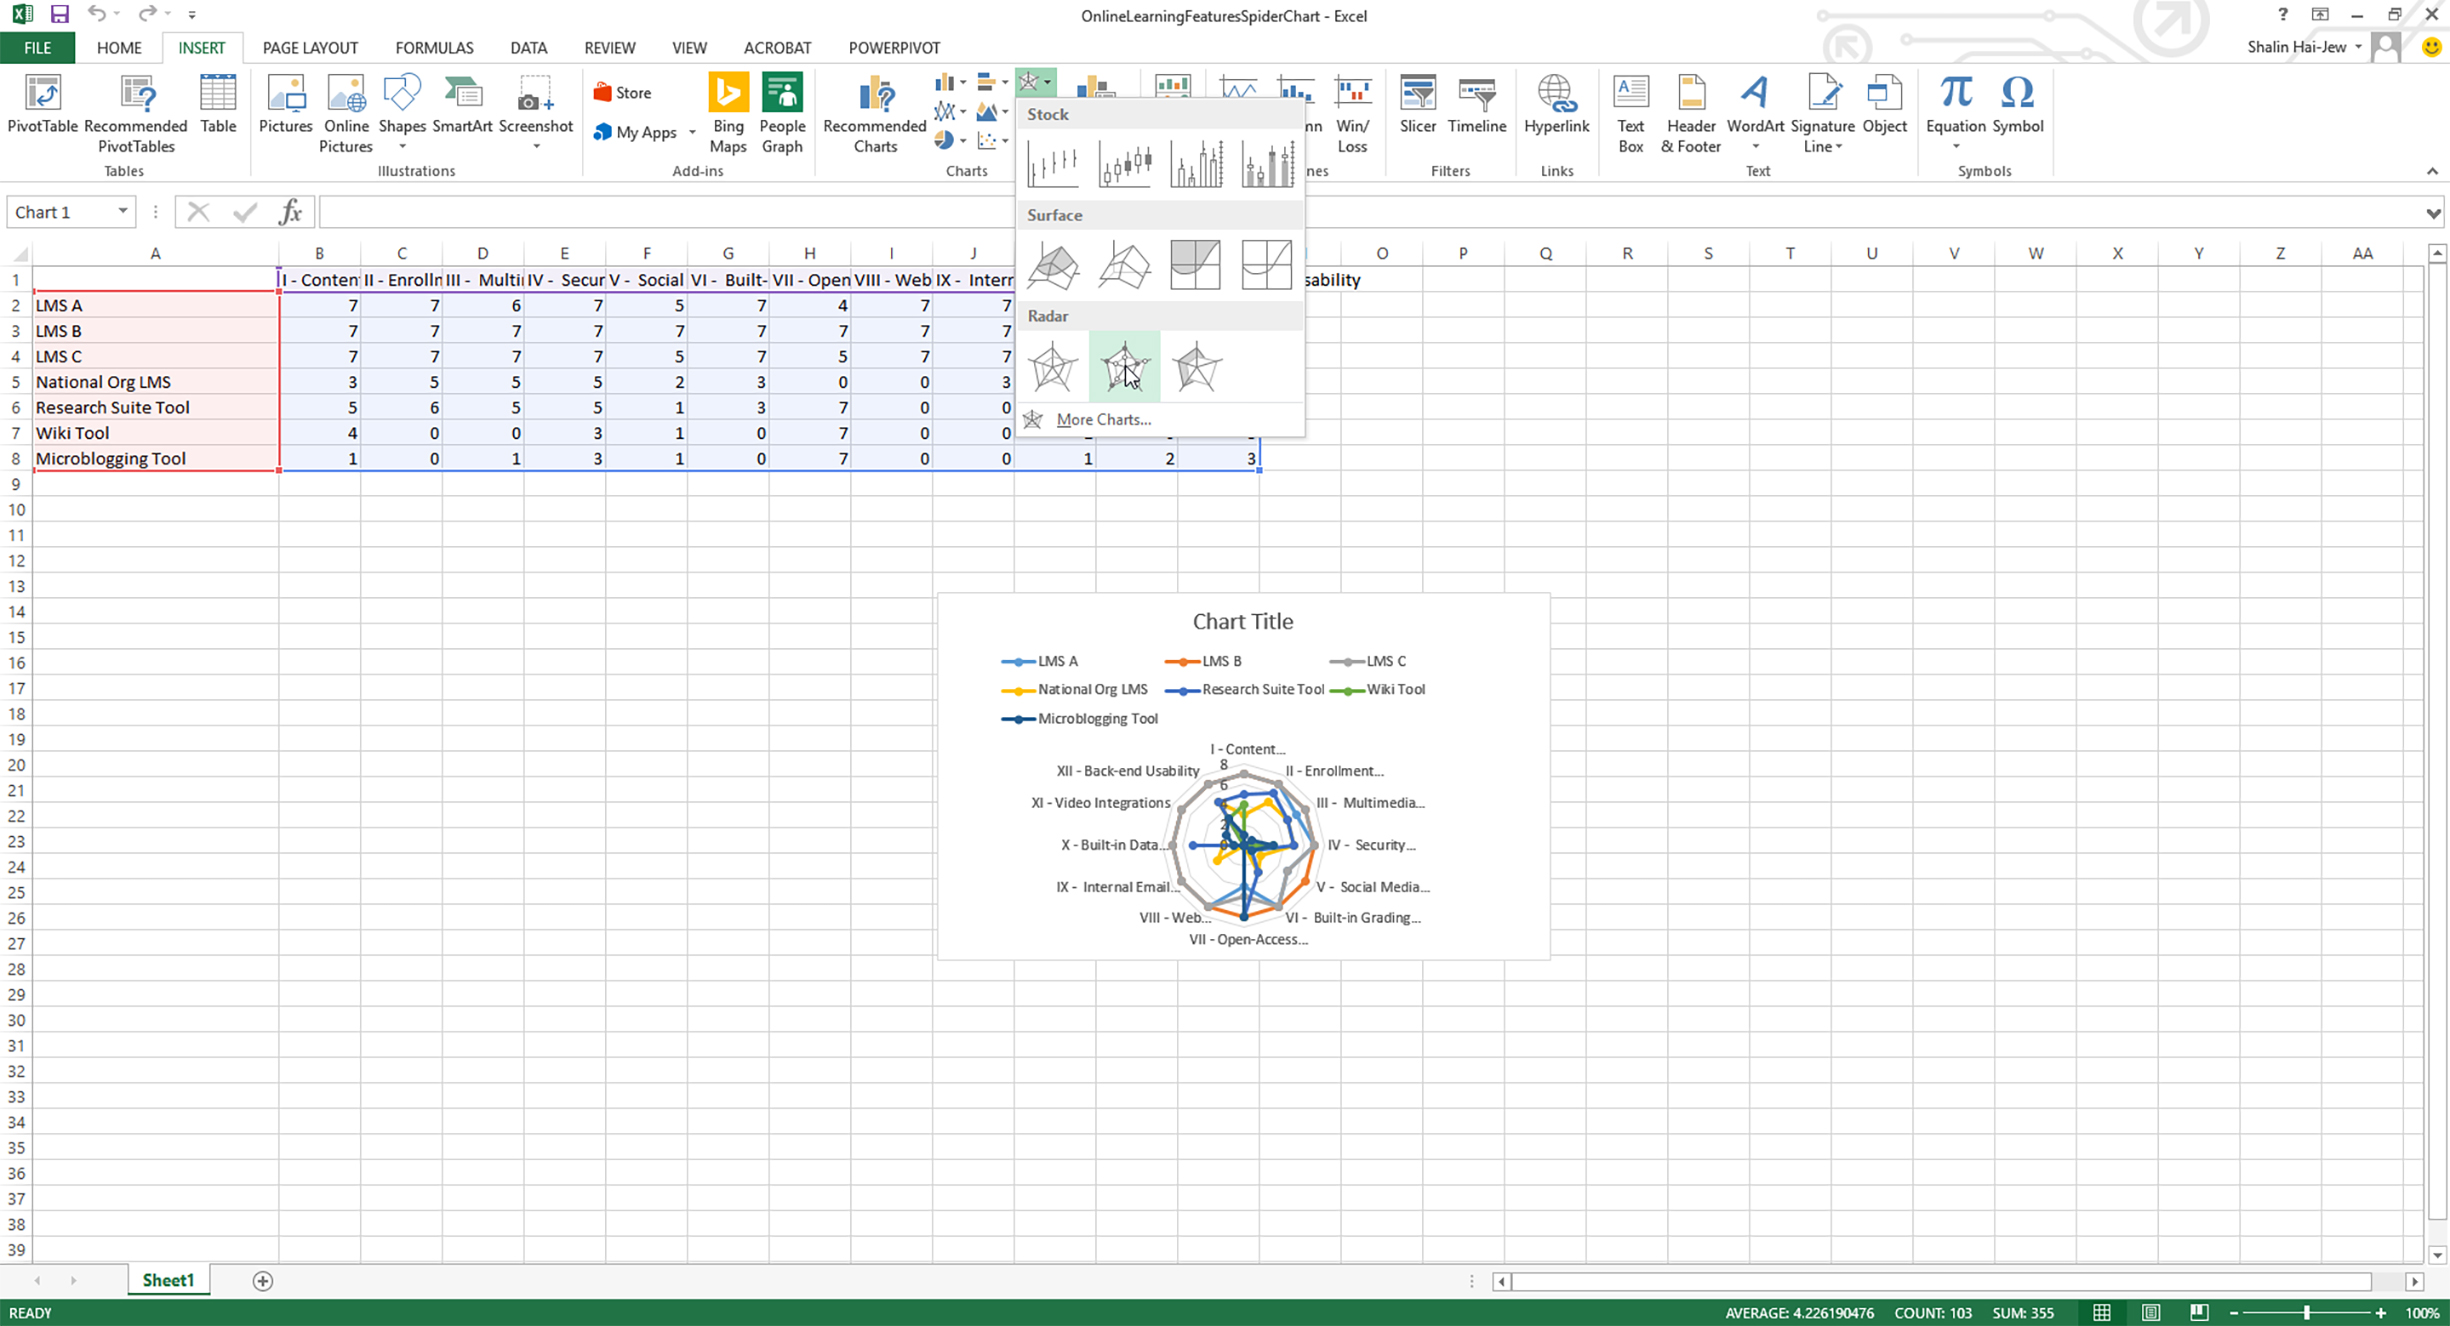
These technology platforms used for learning…and variables that may describe them…may be seen in Figure 1. As with all data visualizations, there is data behind the visualization. Some of this data is portrayable in data tables. So what does the spider chart itself look like? In Excel, highlight the table data; go to the Insert tab, and select the desired radar visualization (Figure 2)
Figure 2: From Data to Spider Chart in Excel
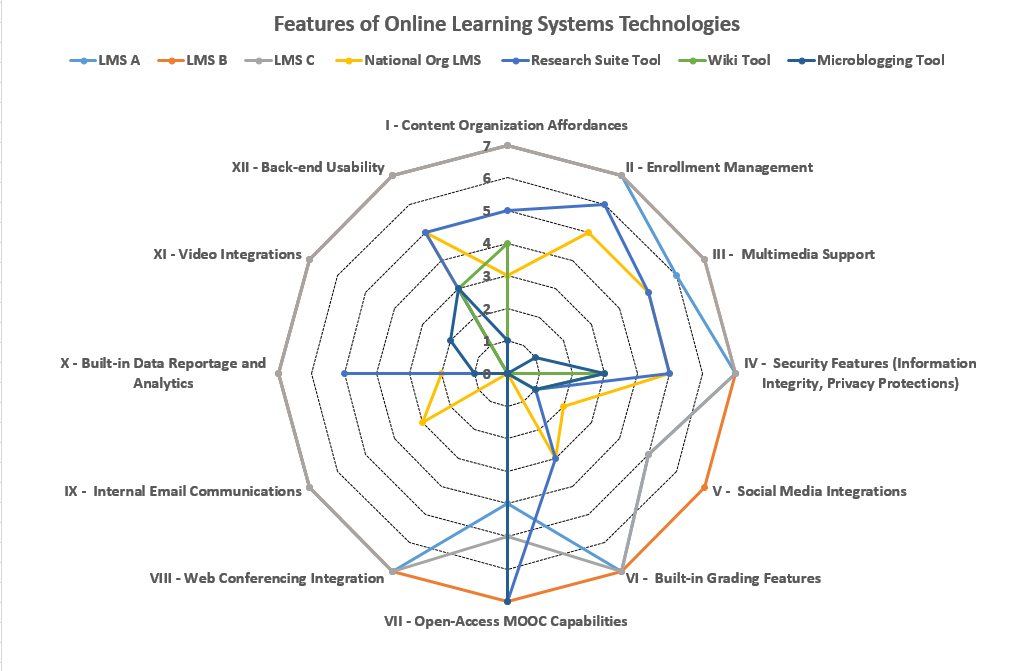
Afterwards, a chart title was added. The text was boldfaced and re-sized for readability. The chart area background (the lines from 0 to 7) was reworked to show the measures.
Figure 3: Features of Online Learning Systems Technologies (a spider chart)
As may be seen, spider charts can pack in quite a bit of information. The labels and the legend (just under the title) are informative, as are the lines. In this scenario, this spider chart may be used to compare technology systems to see which ones may be contenders for a particular learning context.
For other spider charts, builders may choose a different range than 0 – 7. The variables do not need to be numbered, and the “starting at the 12 o’clock position” does not have to be necessarily selected as a layout approach.
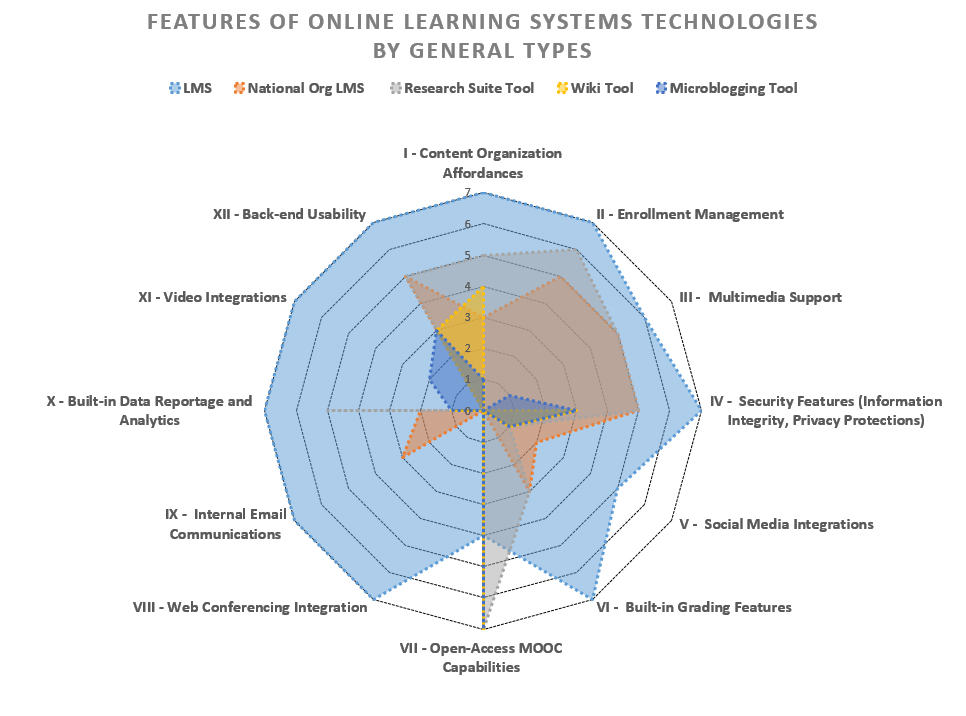
There are a number of layout variations possible here, such as having filled areas for visualizing and applied layers of translucency. (This particular spider chart is too complex to benefit from this “filled image” approach.) To this end then, several LMSes were removed…and the following is the result in Figure 4.
Figure 4: Features of Online Learning Systems Technologies by General Types
In terms of applied approaches, a spider chart is sometimes used as part of a “gaps analysis” to help people identify areas where they are falling short (such as in quality control or in other performance). The identification of areas for improvement (performance benchmarks minus current performance) is used for goal-setting.
The same data may be viewed as a surface chart (Figure 5). In this visualization, it’s quite clear that the advantages accrue to the LMSes (if all variables mentioned are desirable ones).
Figure 5: The Same Data Viewed as a Surface Chart
One more small point: No matter how intriguing a data visualization, each has to be judged and analyzed based on the validity of the underlying data. So where was the underlying data from for the spider chart above? Well, it was from an uncited brainstorm by the author. In this case, it is important to pressure-test the assertions and to go with the available empirical data. So this example is an anti-example. Also, in publication, most data visualizations are shared with the underlying data (Figure 1), to help readers better assess how to understand the data visualization (and not to be unduly influenced by the visualization).
For More
About the Author
Shalin Hai-Jew works as an instructional designer at Kansas State University. Her email is shalin@k-state.edu.
Discussion of "Building a Spider Chart in Microsoft Excel"
Add your voice to this discussion.
Checking your signed in status ...