Modeling change over time
Modeling change over time is a powerful and ubiquitous tool, particularly in the study of history. Students who can model change over time identify general patterns of change, high points and low points, periods of rapid change and periods of little change. They also identify misleading charts, such as ones whose y-axis doesn't start at zero, and therefore exaggerates increases or deceases. Or ones whose time frame may be misleading: a line graph showing U.S. housing prices between 1995 and 2005 is not telling the whole story.
In the humanities, we are likely to use these models as analogies to describe change; we are less likely to derive precise mathematical formulas to model change and project it into the future.
Linear change
Students recognize that linear change means that as time passes, the variable in question--such as income or exports--changes proportionally.
Linear change can be expressed formally using a graph and the equation y = mx + b.
But more often, especially when we are examining social phenomena, linear change is an approximate description of change that is not expressed in a formal equation. It is a way of expressing steady change, even when the data do not conform precisely to the equation y = mx + b. Often, it is useful to break down change patterns into piecewise linear segments of more or less rapid increase or decrease.
Exponential change
Students recognize and describe exponential change presented in graph form, including in graphs in which the exponential growth is conveyed through the axis labels. For instance, in this graph of the growth in the enslavement of Africans between 1500 and 1870, the y-axis increases exponentially.
Nonlinear dynamic change
Students recognize that many phenomena—such as economic growth or the weather—follow nonlinear, dynamic courses. In these systems, small changes are quickly magnified into large changes. In predictive models, small errors in measurement can lead to large differences in possible outcomes.
Accelerating and decelerating change
Students recognize the difference between the absolute change and the rate of change. That is, between an increase (or decrease) on the one hand, and a change that is accelerating (or has negative acceleration) on the other. (In calculus, the first derivative versus the second derivative.)
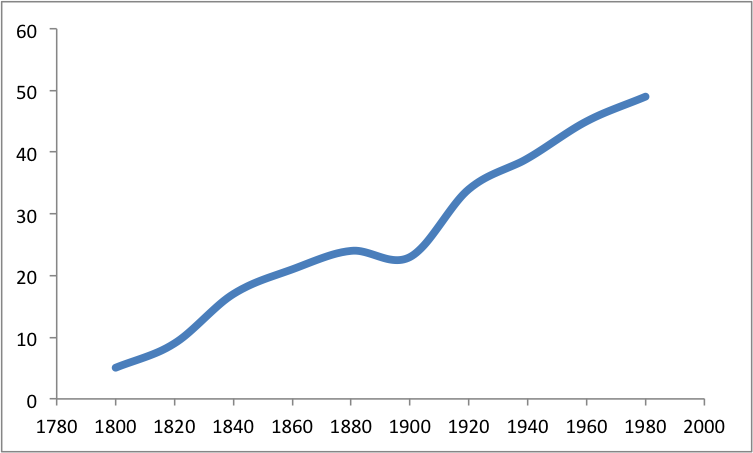
Students recognize that many phenomena--including many cultural trends--follow an S-curve (a sigmoid function) over time.
Students recognize that the S-curve can help us to explain the difference between a decline in growth and a decline in number.
| Previous page on path | Modeling, page 1 of 3 | Next page on path |
Discussion of "Modeling change over time"
Add your voice to this discussion.
Checking your signed in status ...