Using Demographics to Further Explore Interview, Survey, or Focus Group Data
Using Demographic Data
Many who conduct qualitative and mixed methods and multi-methods research will collect data from interviews, surveys, focus groups, and field-based observations (which sometimes include on-ground interviews). The collected data may be in the form of various types of text, imagery, audio, video, and data types.
The most basic forms are in text and in data work sheets. In these latter forms, NVivo enables cleaning, processing, and recoding to enable these to be more easily ingested into NVivo for analysis and computerized querying. "Handling Survey, Interview, and Focus Group Data in NVivo" (.pdf) provides some highlights of this process. (An earlier version of this downloadable file was created as part of a presentation in January 2015.)
Setting the Stage
For a face-to-face training, a slideshow was created to set the stage for understanding the uses of surveys, interviews, and focus groups. The slideshow is available for download at the following link: Reviewing Surveys, Interviews, and Focus Groups.
Extracting the Descriptive Attributes
NVivo enables the coding of demographic data to “person” nodes in order to analyze data based on the demographic subsets within (for cross-sectional or sub-population / sub-group analysis). In other words, the descriptors for the various case nodes enable different types of "faceted" searches based on particular facets of the "person" or "organization" (or other type of node entity).
In other words, researchers may ask questions like the following:
In other words, researchers may ask questions like the following:
- Regarding a particular issue, what were points of (dis)agreement between the male and female respondents?
- What were salient points of agreement or disagreement between respondents of different age groups? Of different geographical regions? Of different cultures? Of different racial backgrounds? Of different ethnicities?
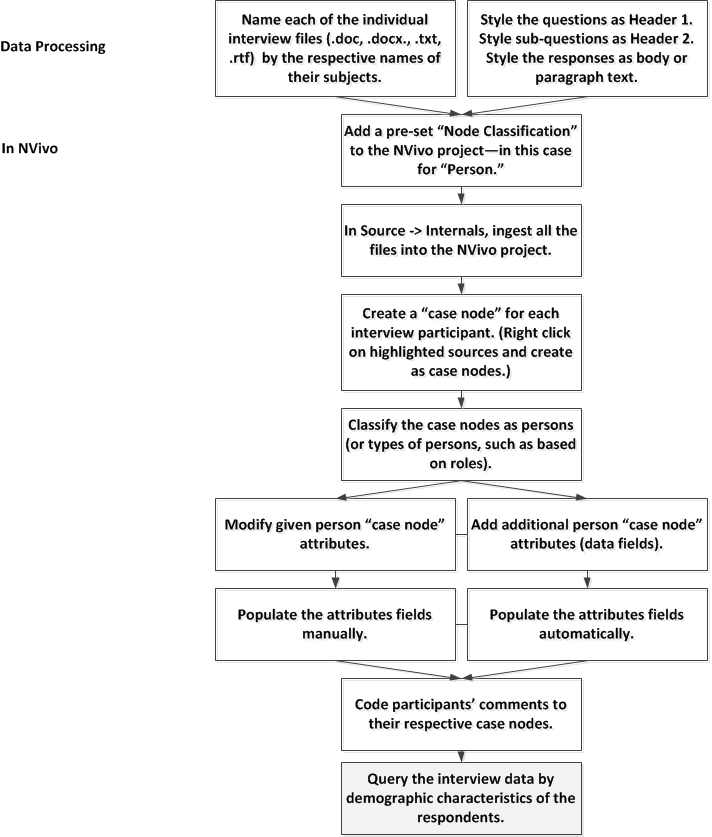
The process sequence goes as follows.
A Step-by-Step Walk-through of Some Options
What follows is a step-by-step “demo” about how this would work. This is created using synthetic data files for the purpose of showcasing the steps.
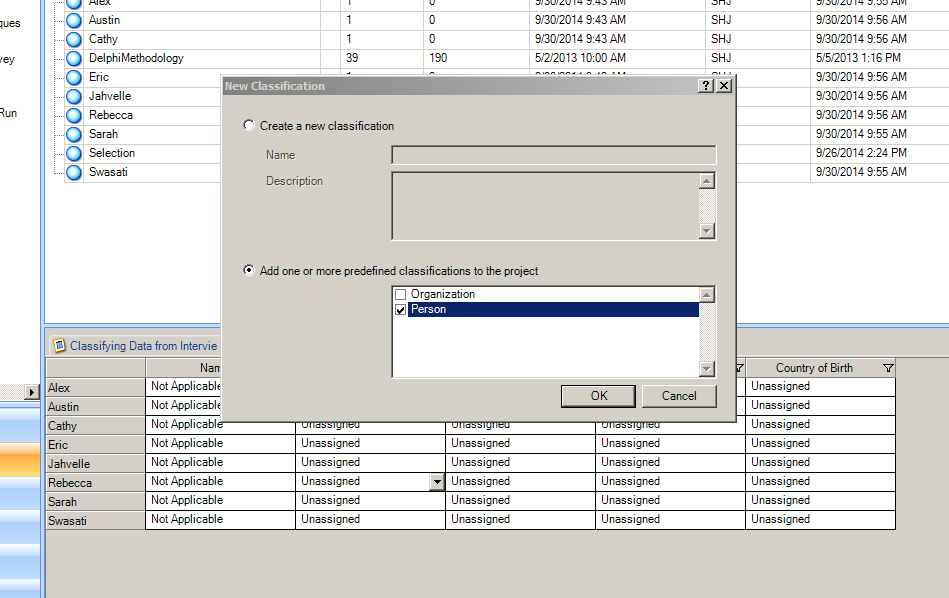
Turning on the person case node selection. To use the “person” feature on case nodes, a user first has to select in this feature. Go to the Create tab of the NVivo ribbon. In the classifications section, click on Node Classification. The “New Classification” window will open.
Select the second option: “Add one or more predefined classifications to the project.” Select “Person.” Click "OK".
The project is now ready for the uses of case nodes that are classified as “Person” ones.
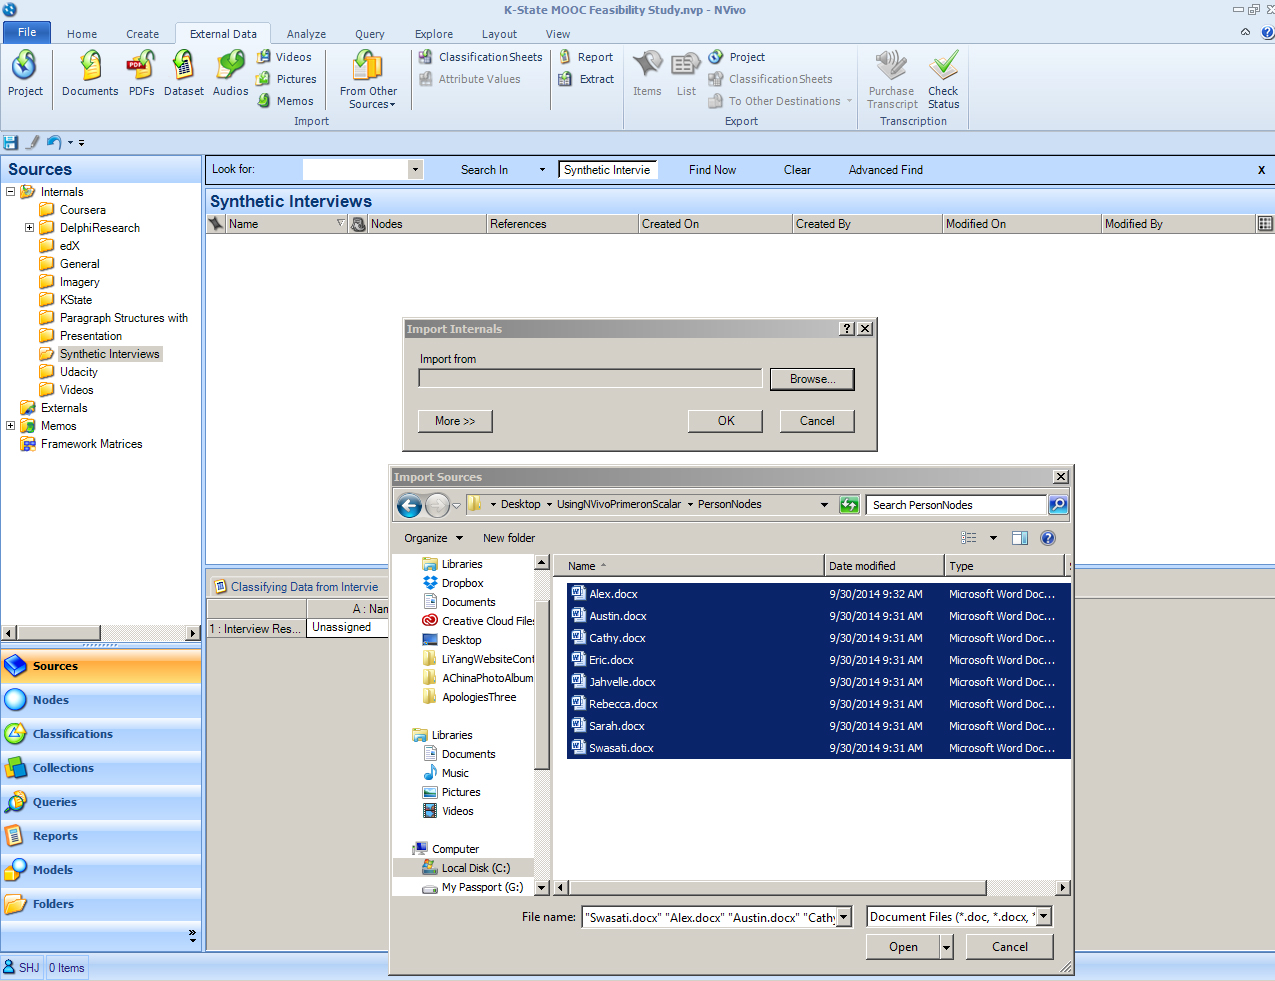
Ingesting the interviews
In the NVivo project, create a folder in the Sources -> Internals to house the interviews. For our purposes, we used “Synthetic Interviews.” In the NVivo ribbon, click on the External Data tab. Click Documents in the Import area. Browse to the desired files. Highlight them all.
Click "Open". Then in the “Import Internals” window, click "OK".
Now that the interviews are ingested as “documents,” it is time to change them to “case nodes.” (A "case node" is a special type of node which may be categorized as a type. This typing of the node means that it is a category or grouping of node. As such, each "case node" then will include a set of descriptive information related to that case type. The classification fields are specific to the node type. For each node, though, the data in each field will be potentially quite unique.)
Defining interviews as "case nodes"
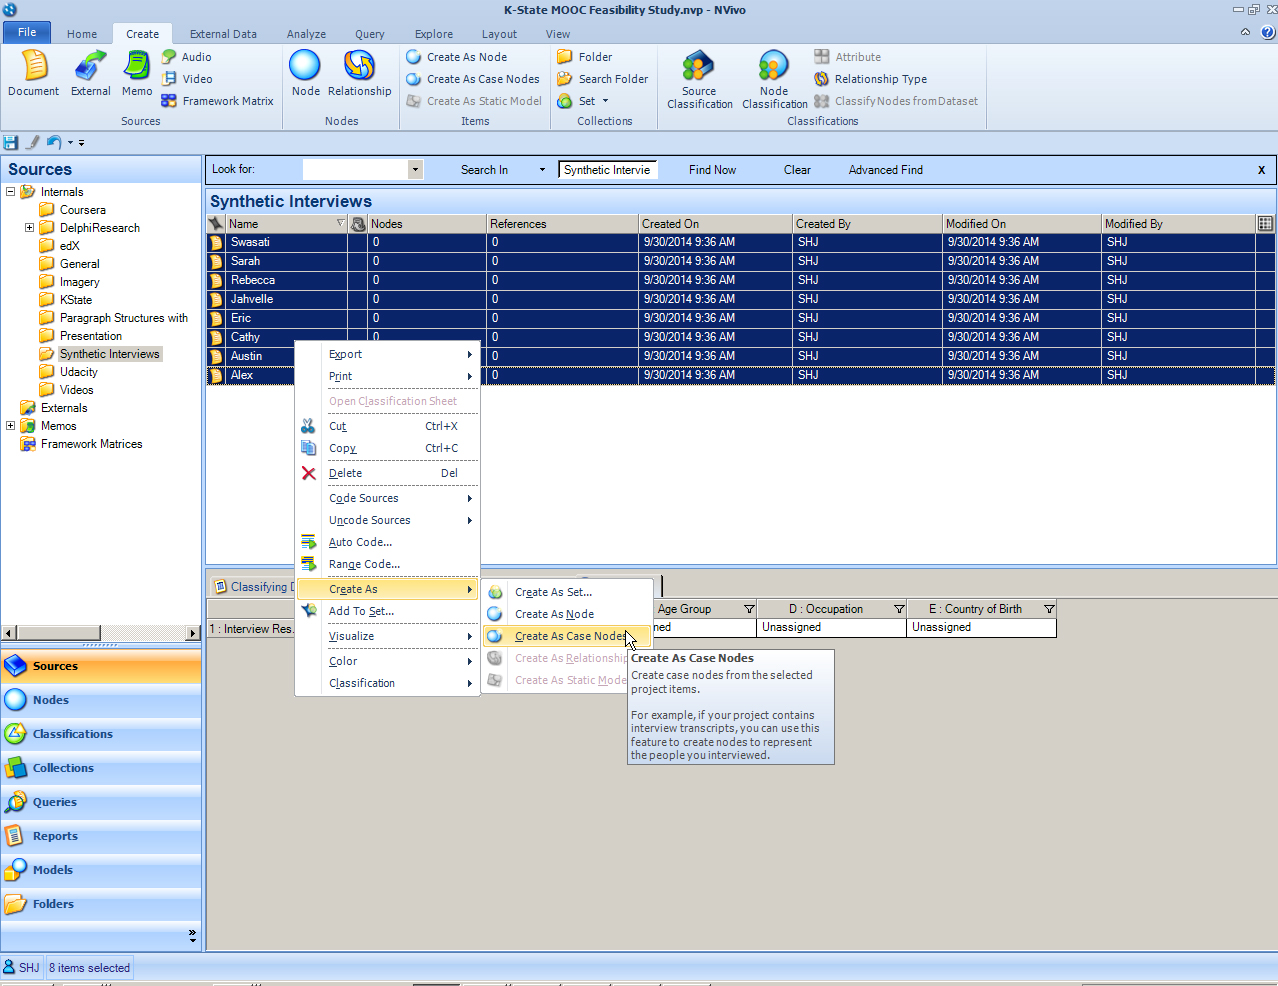
In the Detail View, highlight all the interviews. Right click for the dropdown menu. Create As -> Create as Case Nodes
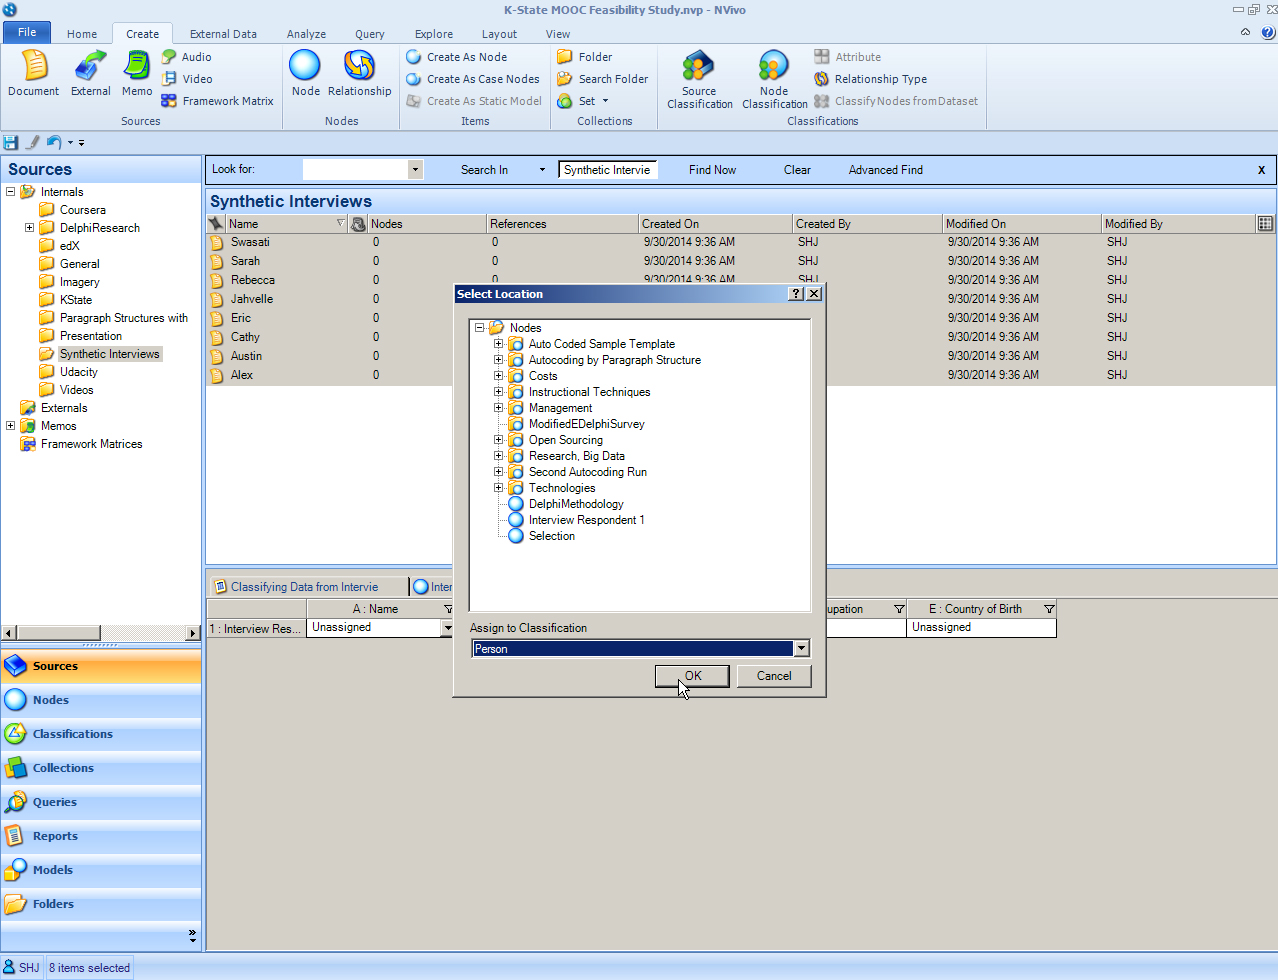
The “Select Location” window opens. The user has to decide where these nodes will be placed. The default is in the top level of the nodes area. The “Assign to Classification” default is set to none. The user needs to select “Person.” Click "OK".
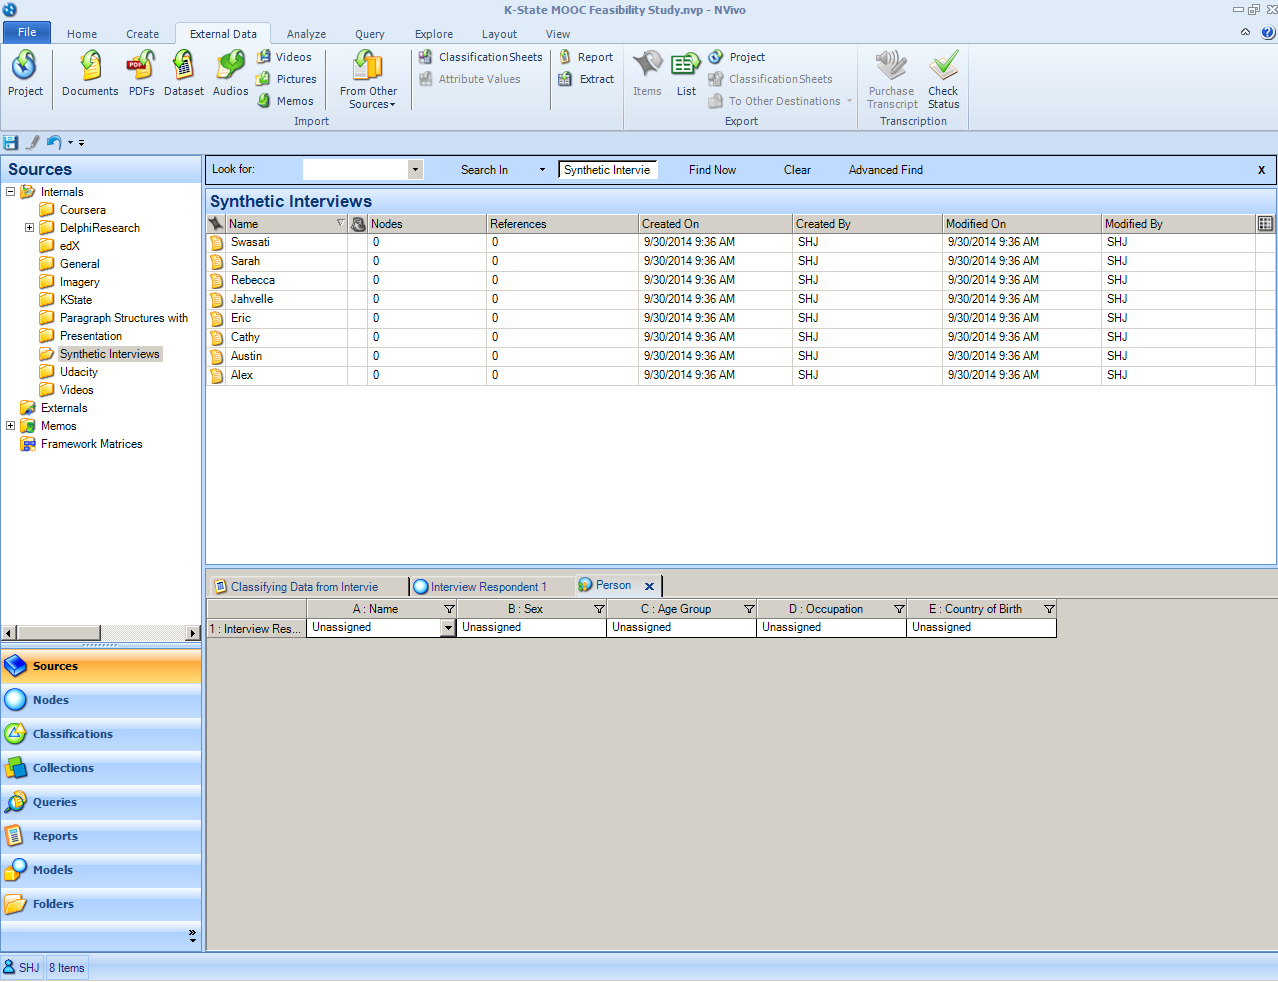
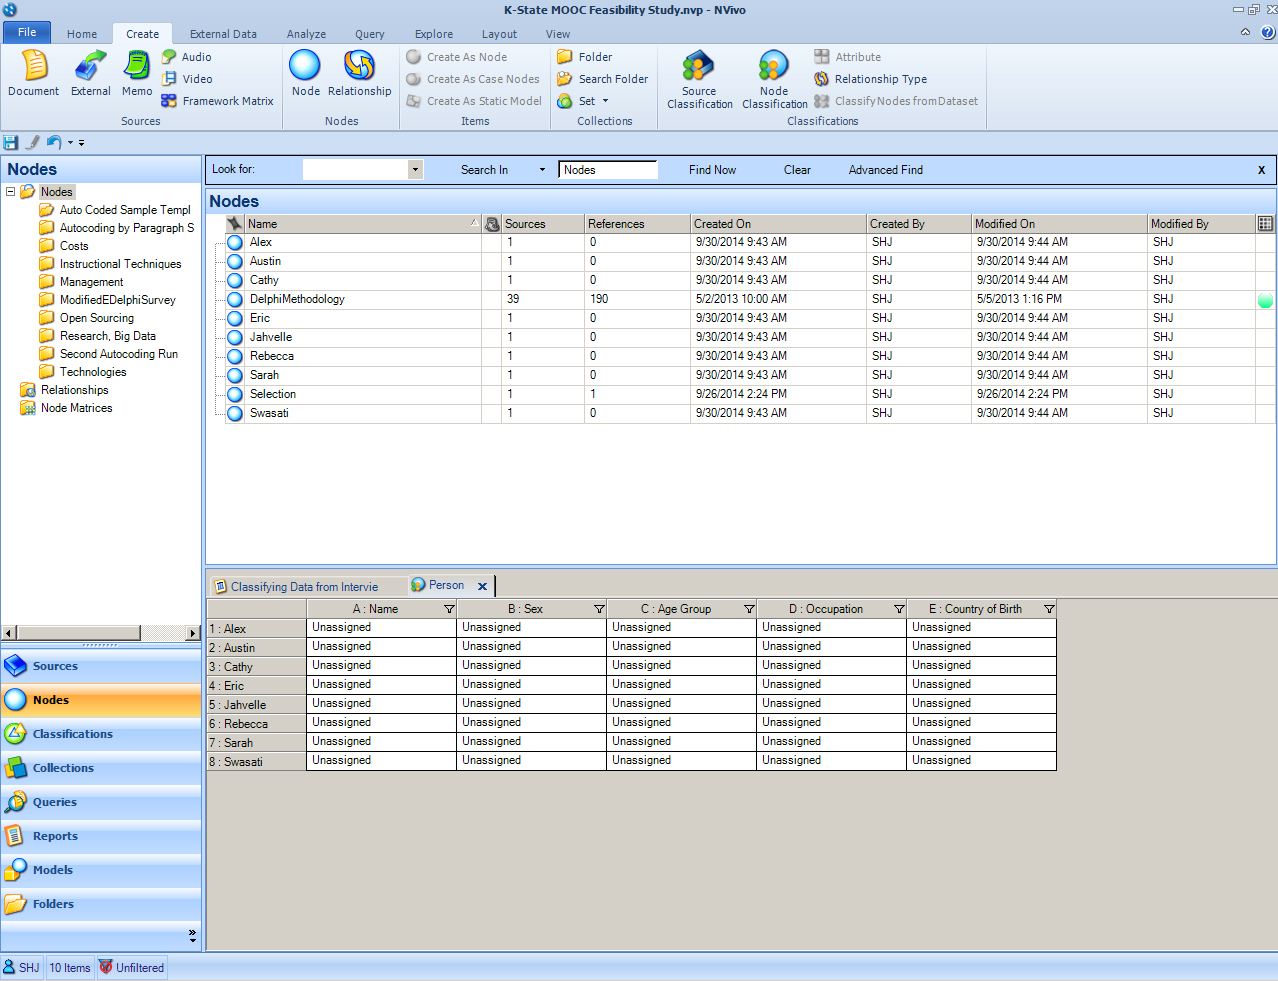
The nodes may be seen in the Detail View with the person classification linked to each name or unique identifier (record) below.
The default attributes for a person-type of “case node” includes the following text fields: Name, Sex, Age Group, Occupation, and Country of Birth. These are the default fields, but these may be revised, removed, or added to--based on the needs of the researcher and the requirements of the research.
Adding or revising attributes to the person node classification
To add or revise attributes to the “person” node classification, changes have to be made at the global level (so that the changes apply across the project). Go to the bottom left menu in the Navigation View and click "Classifications". Select the "Node Classifications" folder at the upper left area. The attributes may be viewed in the drop-down under the Person node classification in the Details area. Right-click on any attribute to revise it.
Adding a new attribute
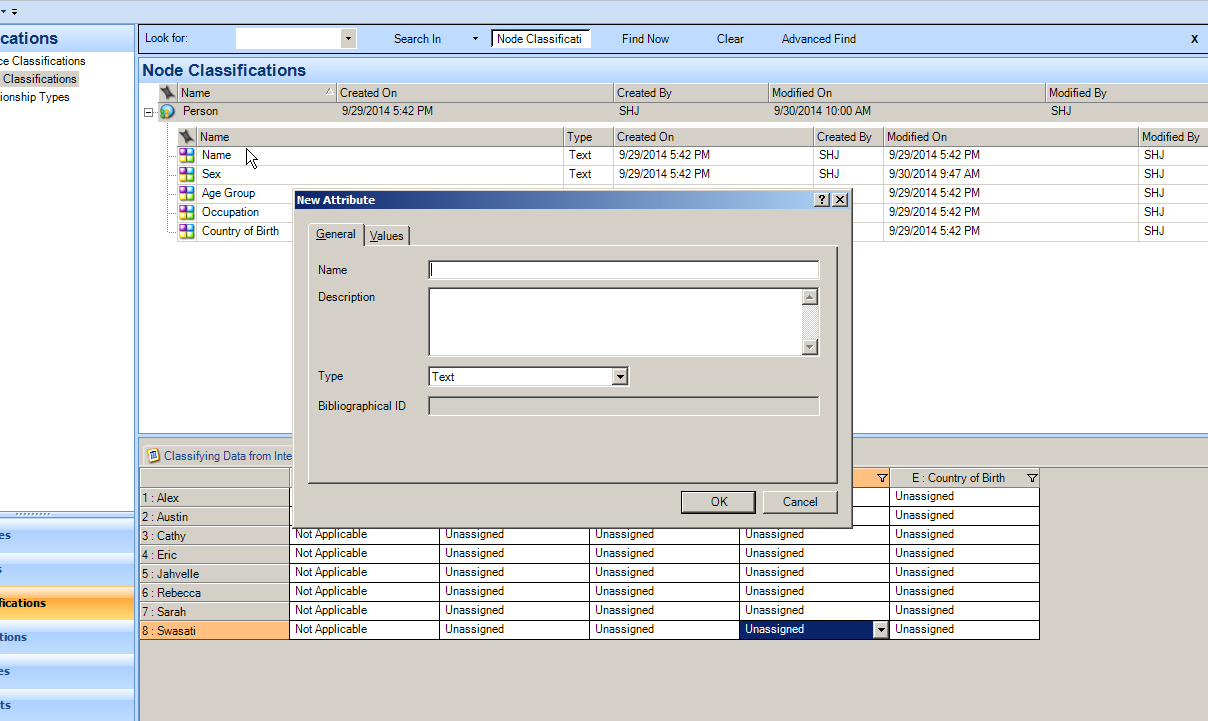
To add a new attribute, right-click the Person node classification. Click "New Attribute". Fill in the name of the new attribute, and write in the desired description.
After the user clicks "OK", the attribute now appears under the particular node classification, and a new column has been created in the data. This column should then be populated with the relevant data.
Inputting specific data for the person “case node” attributes
Researchers may place data for the “person” attributes in the case nodes in two basic ways. (1) One way is through the respective individual nodes. (2) The other way is through the classification sheets.
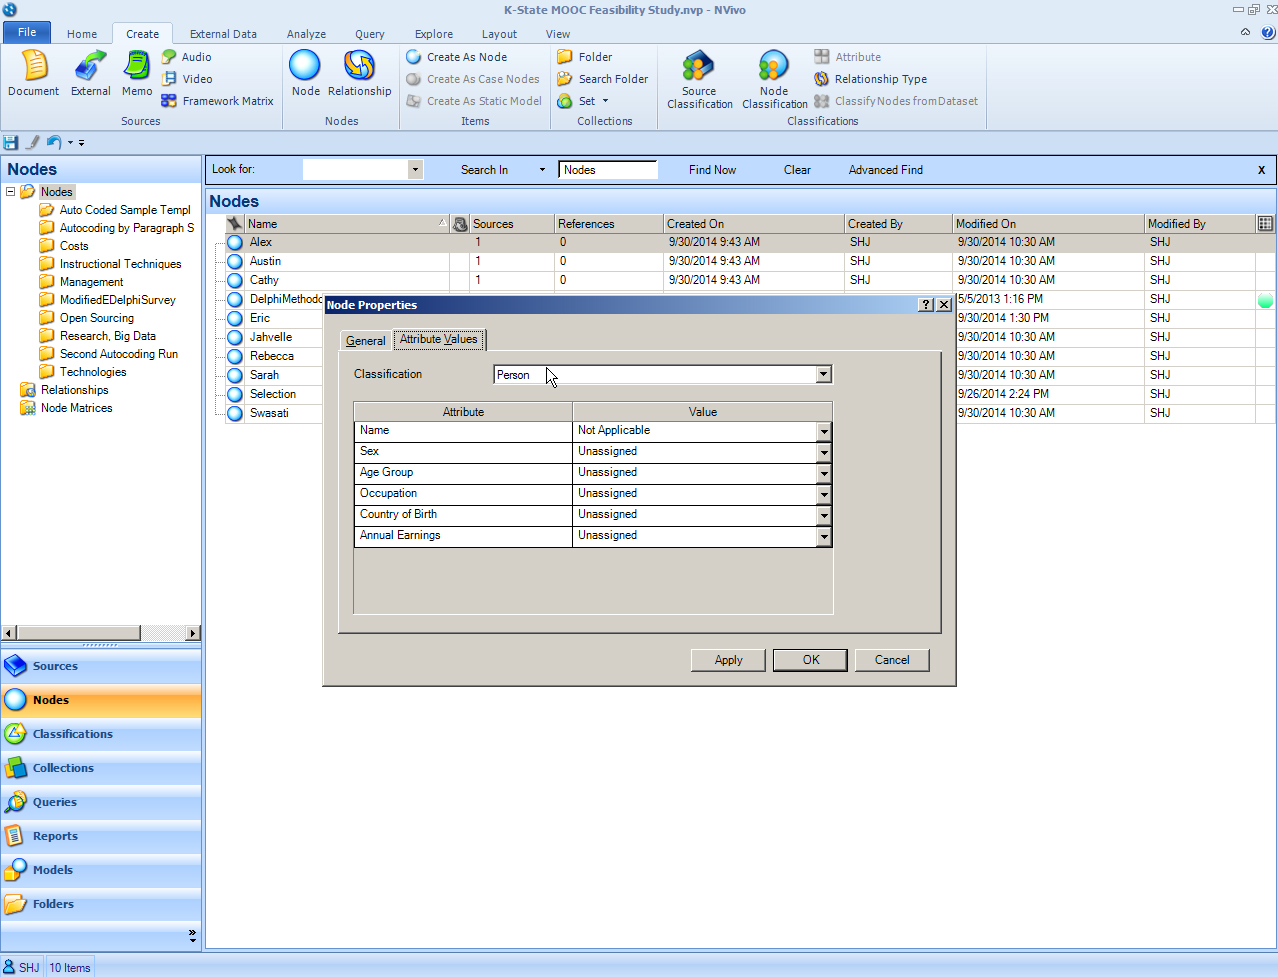
(1) Go to the "Nodes" area in the "Navigation View". Right-click one of the nodes. Go to “Node Properties.” Go to the "Attributes" tab.
(1) Go to the "Nodes" area in the "Navigation View". Right-click one of the nodes. Go to “Node Properties.” Go to the "Attributes" tab.
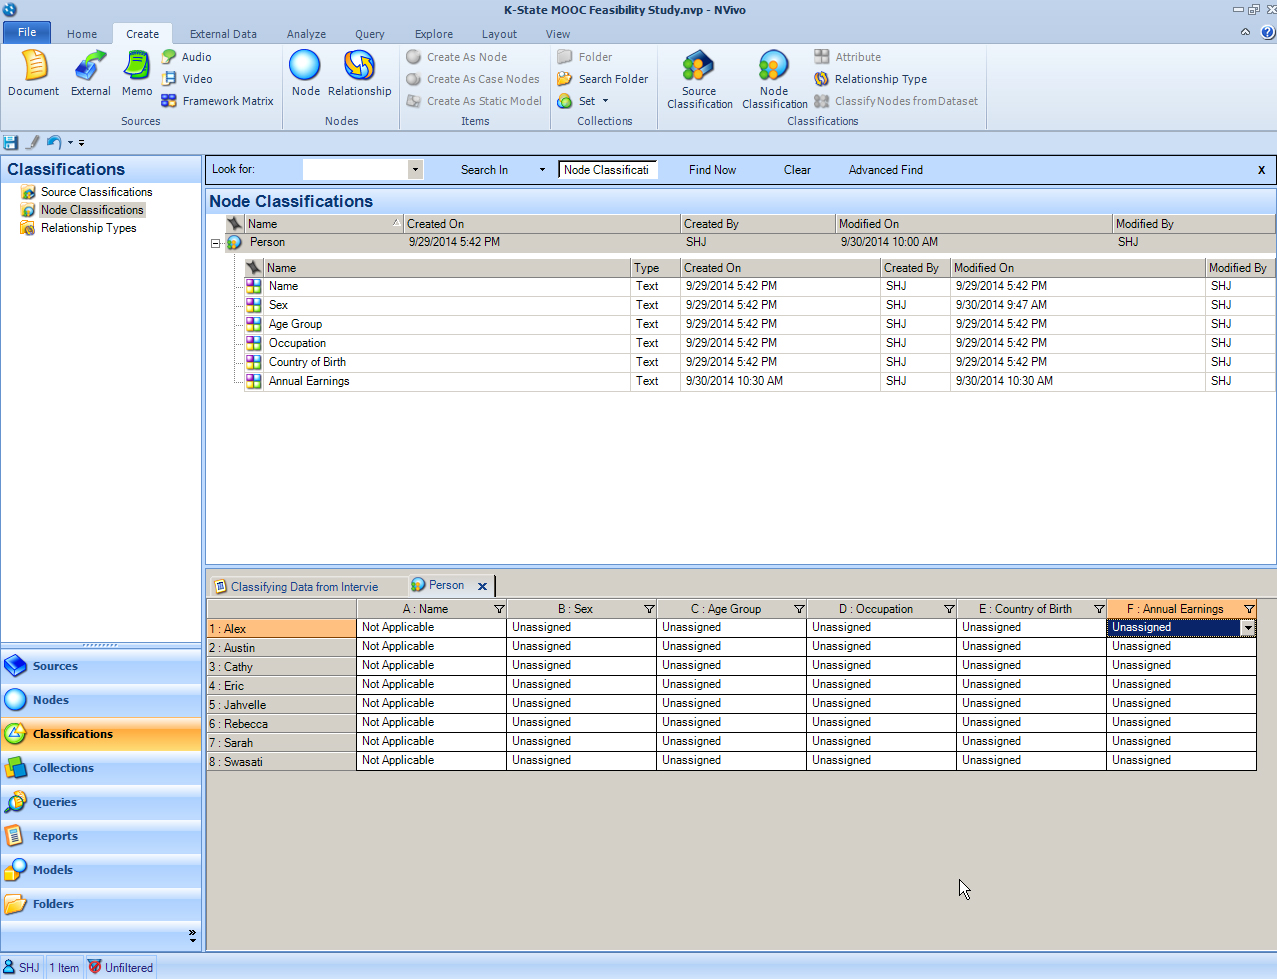
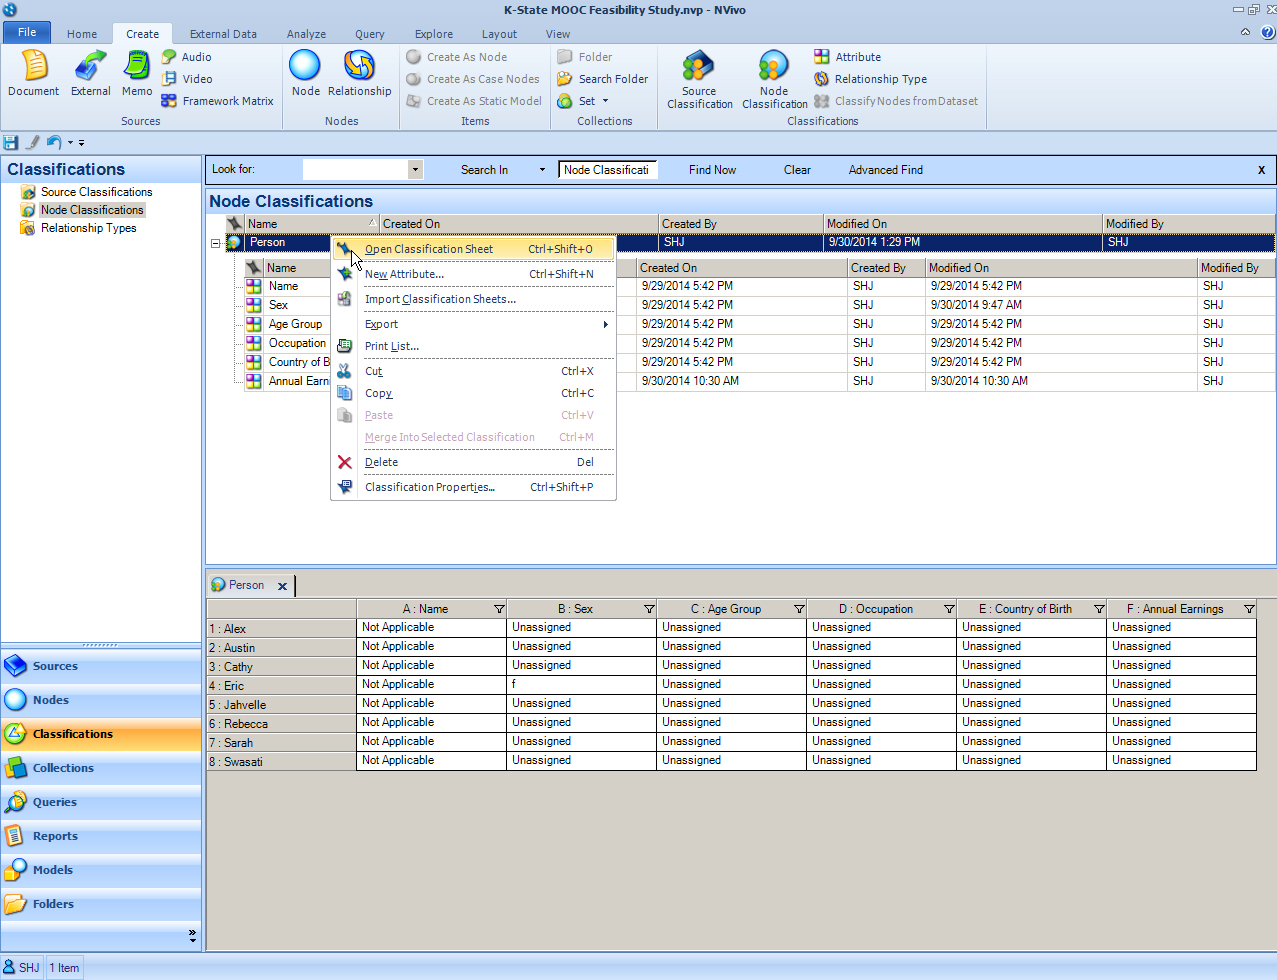
A person may code the data this way. The other way to code this data is through the Classification -> Node Classification area of the Navigation View. Click the Person node in the Detail View to activate it. Right-click to open the Classification Sheet.
Coding with the classification sheet
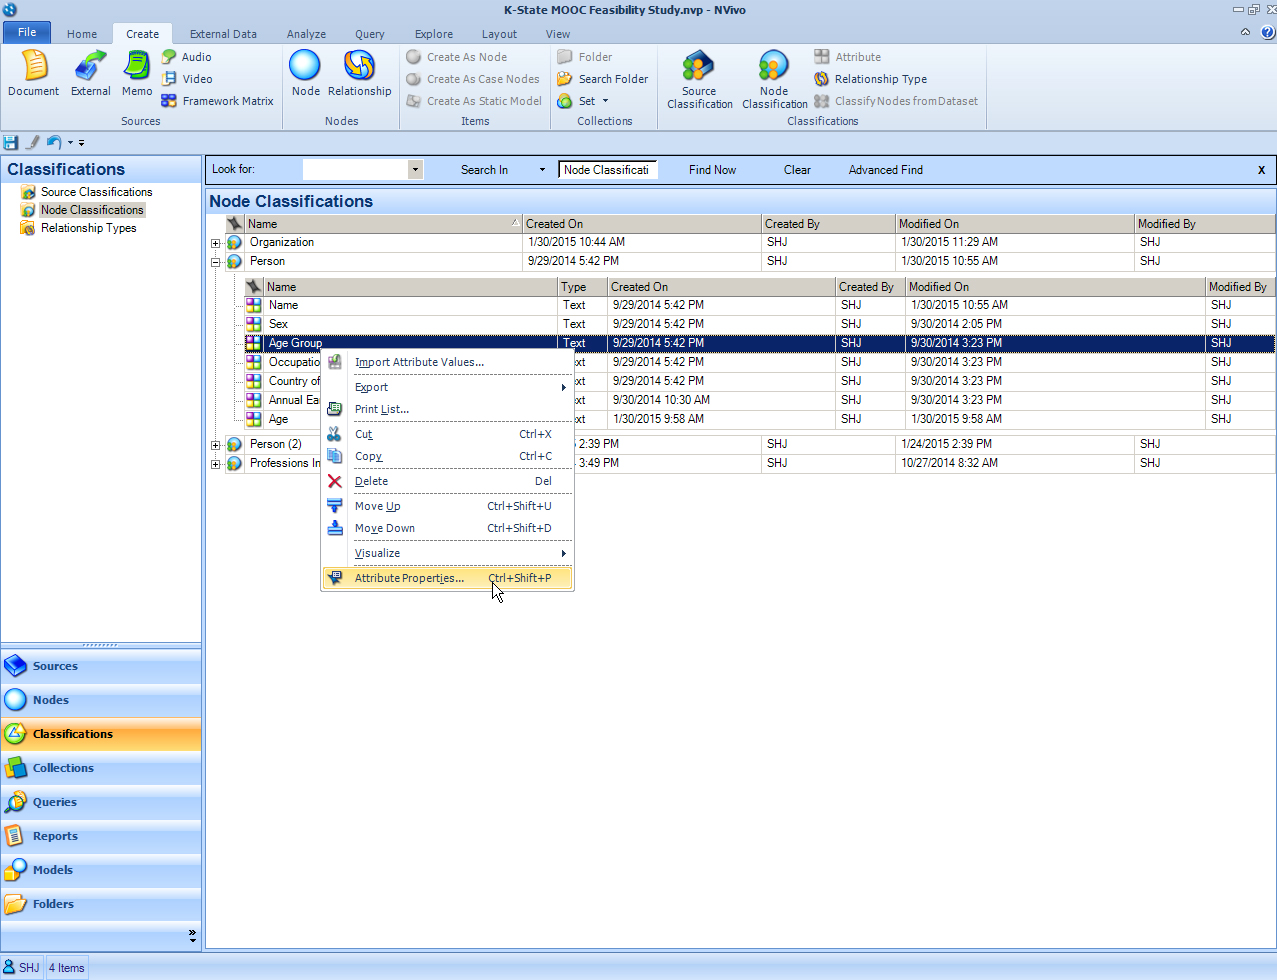
To use the classification sheet to code values, a researcher needs to first set the ranges of attribute values. In the Navigation View, go to Classifications -> Node Classifications -> the selected Node Classification (Person). Click on the plus sign to reveal the attributes for the respective node classification.
Right-click on the attribute, and go to "Attribute Properties".
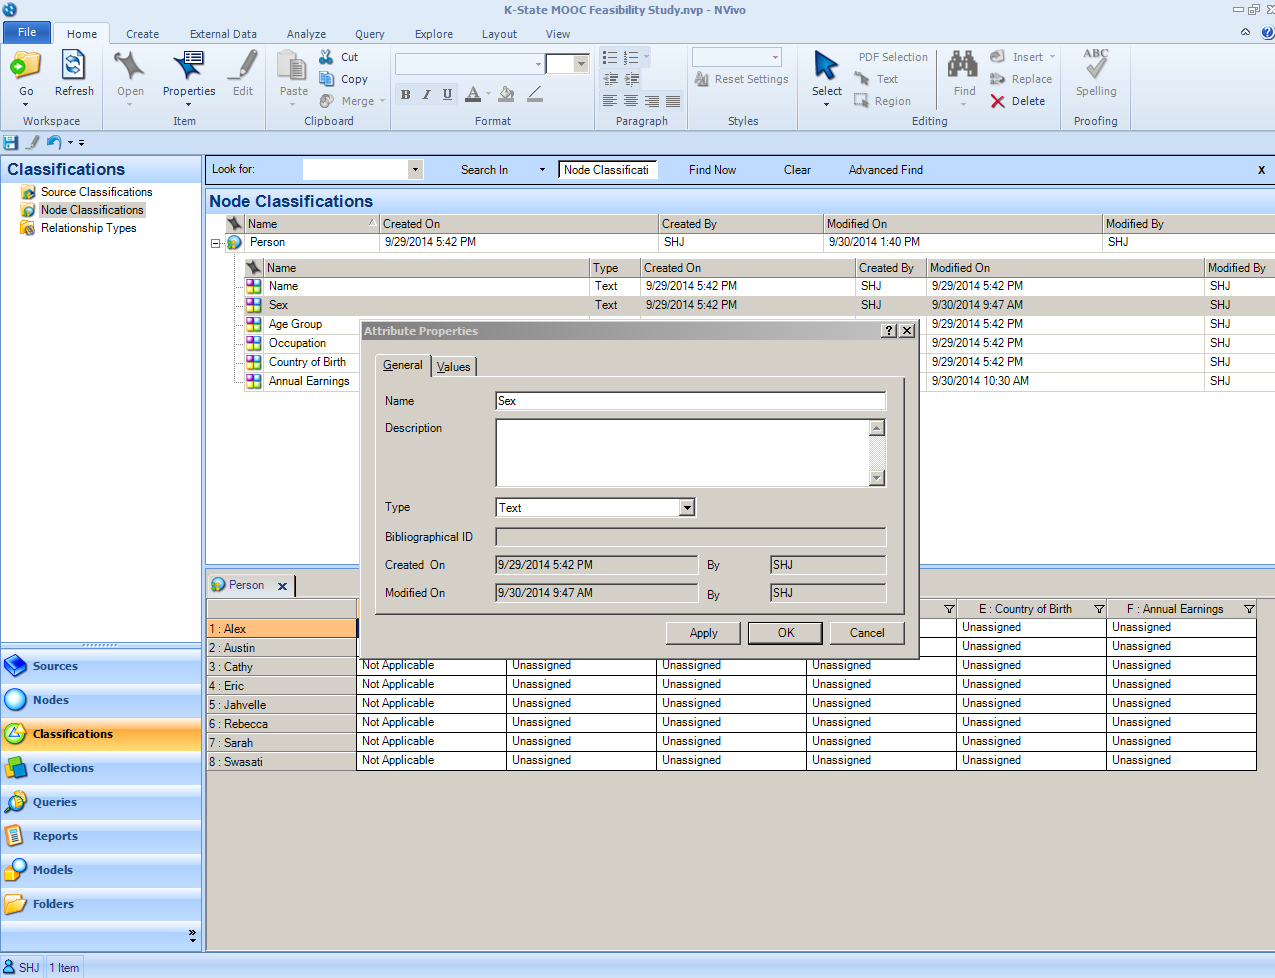
The "Attribute Properties" window opens. It has two tabs: general (with the name and a description of the attribute and a dropdown menu of its data type: text, integer, decimal, date/time, date, time, or Boolean), or values (which enables pre-sets for types of values which may be applied to attributes).
Click on the Values tab in the Attribute Properties.
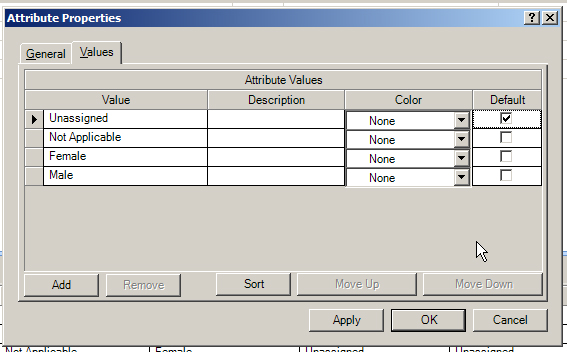
Add Attribute values
Click "Apply". Click "OK". (What is grayed out is not editable by the user. Once "immutable" attribute data is ingested into NVivo, it is not editable--so as to protect the data against human manipulation. If attribute data is brought in as "mutable," then the related data cells will be editable. "Immutable" means unchangeable, and "mutable" means changeable.)
Now, in the classifications sheet, the dropdown for each cell contains the four choices.
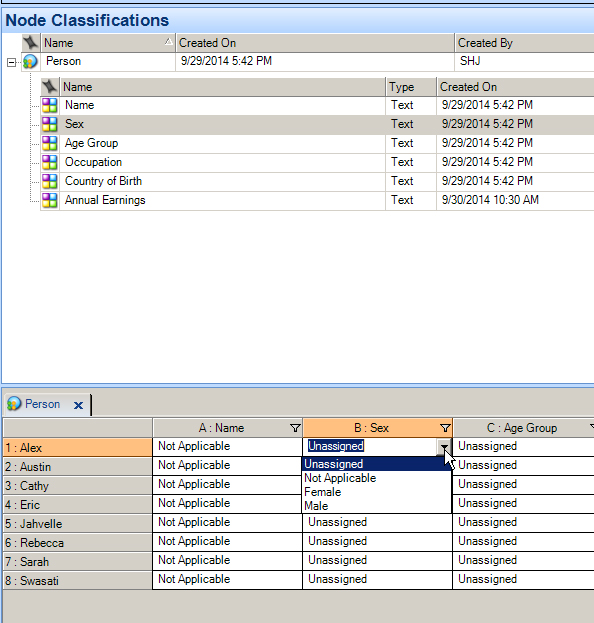
Once all the attribute properties are set, the researcher can then go to the classification sheet. From here, the drop-downs should be updated and selectable.
Ingesting a Spreadsheet with Demographic Coding Data
What if researchers have a fairly large amount of people-based data? What if they have the correct file names linked to each of the respective interview transcripts? In that case, it may be more efficient to upload a classifications spreadsheet and then link the descriptions to respective case nodes (derived from the individual transcript files).
There is one other way to both input the attributes (demographic variables) and their values simultaneously (to nodes coded with the person) by using an .xl or .xls file. To proceed, go to Classifications in the Navigation View. Generally, it helps to use the data structure already understandable to the software tool. In that spirit, it is a good idea to download the built-in Classification Sheet. A screenshot of it follows.
Notice that the first column contains what NVivo calls “hierarchical source names.” These include the folder structure linking to the source.
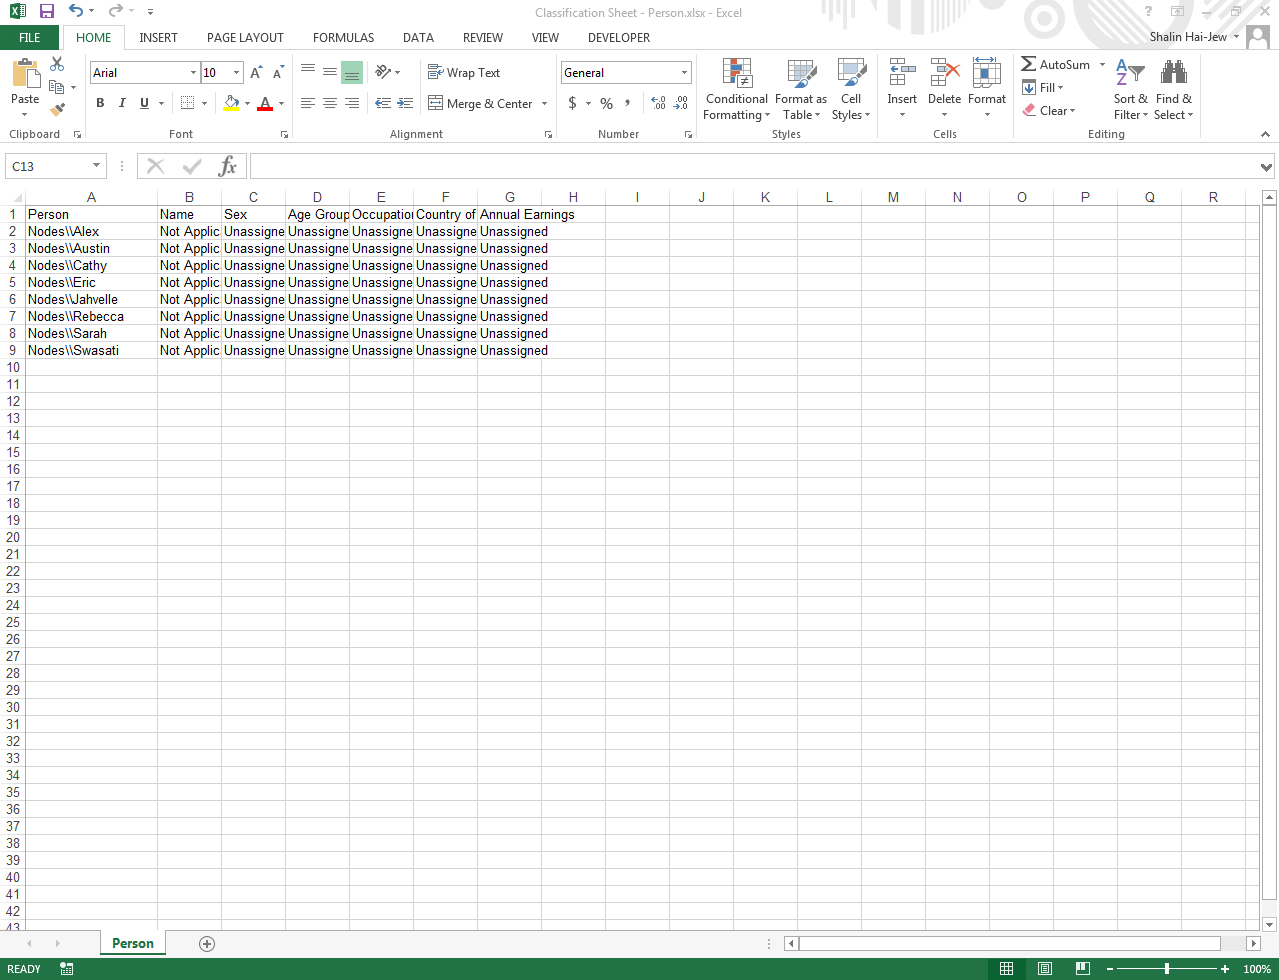
The cells in the above sheet may be populated with data.
In the Detail View window, right-click and select "Import Classification Sheets".
Re-import it. Such sheets should be properly structured. The nodes should run down the left column, and the variables should run across the top row.
Make sure to indicate that the data worksheet is being ingested as having “hierarchical node names” (or hierarchical source names, whichever applies).
Classify Nodes from the Dataset (Wizard)
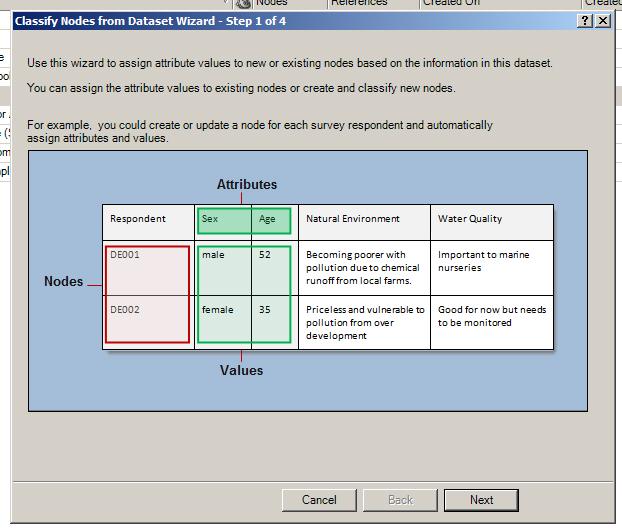
Another approach involves automatically ingesting data with each record (individual) treated as a node and attribute columns about them included with the node. To achieve this, go to the Create tab. In the Classifications grouping, go to "Classify Nodes from Dataset." The Wizard will open and enable the classifying of dataset information as individual records. This is especially useful for online survey data, for example, which tends to offer structured data. The pink highlight shows the rows which will be treated as single nodes, and the green highlight shows the different attributes.
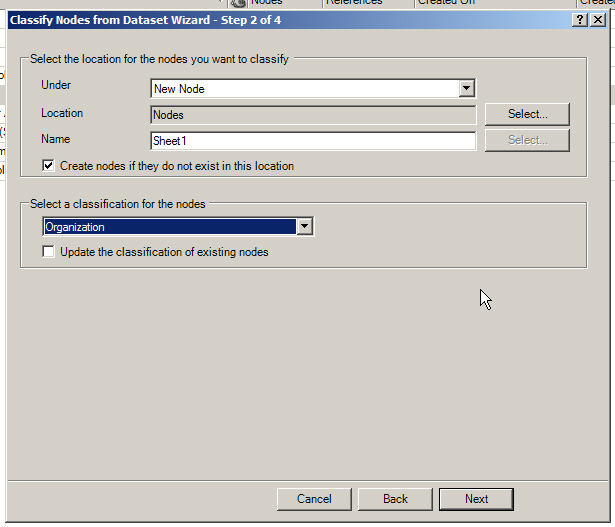
In the next window, researchers are asked to set the location for the new nodes, whether this is to an existing node or new node, an existing folder or new folder. Then, users have to decide the type of node classification for these nodes (such as "person" or "organization"). The classification types for the nodes have to be made ahead of time and cannot be made on-the-fly in this sequence.
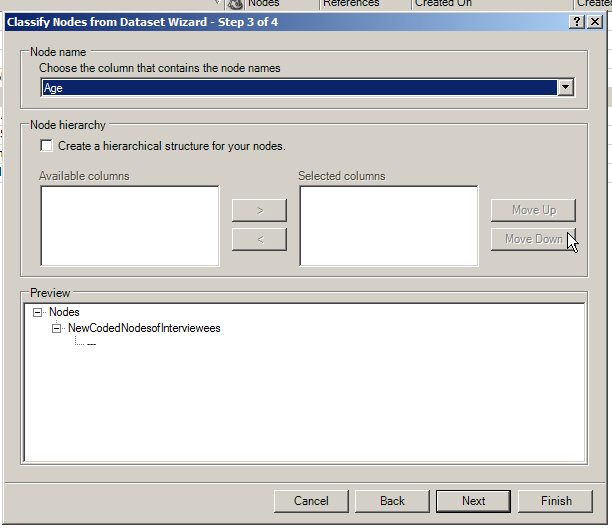
In the next step, the user needs to define the column which contains the names (usually A1). If researchers want, he / she / they may choose to create a node hierarchy based on the attribute data describing the nodes.
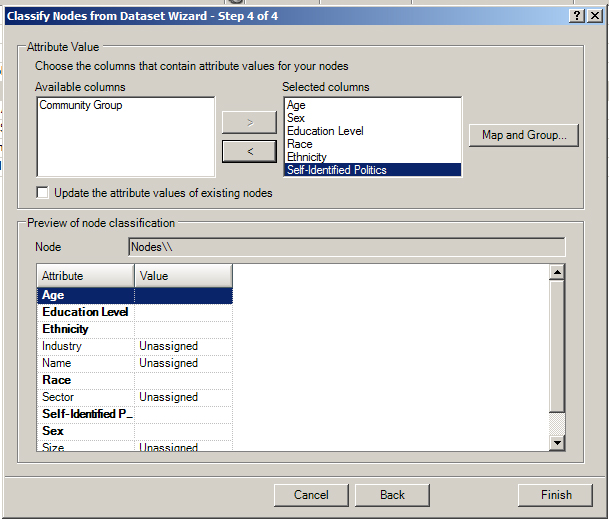
Then, in the fourth step, researchers may select the columns with attribute values describing the individual nodes. They will be able to see a preview of the resulting node classifications. The screenshot below was created without using an actual dataset, so this is not as representative as it could be.
For More
For more information on “Import (or export) classification sheets,” please link to this source. QSR International also has a strong source describing how to organize demographic data.
As one more side note, some of the categories may be used as "dummy variables." A binary categorical variable (such as "male" or "female"; present or absent; specific experience or absence of that experience) may be used in a Boolean way to look for comparative differences. These will not be used in the same way as in a linear regression, but they are still helpful to group respondents in order to look for similarities and differences in responses and other patterning.
Discussion of "Using Demographics to Further Explore Interview, Survey, or Focus Group Data"
Add your voice to this discussion.
Checking your signed in status ...