Processing Qualitative Text Responses from Online Survey Data (with Excel)
While NVivo enables a broad range of features for research, it does not have to be the only tool used as the technology for qualitative and mixed methods data analysis. Excel combined with Word can offer some ways to make data analysis more efficient. To that end, this page highlights some ways to use Excel (and Word and Notepad) for this purpose.
Online Survey Systems
The way a survey is designed affects the types of information that may be extracted. By design, this does not only refer to the question types and formats but also how the various features of the online survey system are deployed and set. For example, a question may be phrased as an open-ended one, but if the survey designer does not enable a text response or a sufficient length of a text response (or a text response that enables a variety of language responses or the inclusion of different types of relevant notation), then the effectiveness of the question itself is mooted by the technology.
Accessibility features. Not only does the structure of each question have to make sense, but such surveys should also be fully accessible (with transcription of all audio and video, alt-texting of imagery, readable data tables, no uses of color only to convey information on maps and images, and so on).
Pilot testing all surveys before live launch. This is why it is so critical to pilot-test all surveys not only with experts but with the individuals who may be responding to the survey. The pilot test should include multiple walk-throughs of every survey feature used.
Downloading full data responses. Many researchers will use an online survey system without testing what the data looks like on the back end. This is an important aspect because the researcher and research team have to be able to make sense of the data once it has been fully collected. (Some researchers will design complex questions with multiple moving parts and then have no idea how to process the data once it has been collected.) Most systems are capable of enabling a variety of file formats. However, there are various levels of data processing that are done within the system. For example, the typical descriptive statistics of means, medians, and standard deviations are often output for quantitative data (with the underlying assumptions of the Gaussian curve). Currently, there are no automated text summarizations for qualitative data (even though the technology exists for such automated outputs).
Most online survey systems enable the downloading of full reports from a survey or question-by-question data downloads. While the first offers a general summary, a .pdf or .docx report is generally unhelpful for actual data analysis. Rather, for complex surveys, it is important to go question-by-question to download the full dataset as a .txt / .csv / .xls / .xlsx file, so that various types of data processing and data analysis may be achieved. Some systems—such as Qualtrics—will show only the first 100 text responses on the web interface and enable a table download. The table download then only enables access to the viewable 100 responses. To access the whole dataset, it is important to click the link which enables access to all text responses as a downloaded file.
As is common practice, the downloaded data is first extracted as a pristine set, which is kept protected and isolated. A working set is used for the actual data analysis. Also, the survey itself and its results are kept archived in the survey system to enable later access and possibly other analytical techniques as they become available.
Fully Exploiting the Data
Many who use surveys are focused on answering particular research questions based on how they set up their research. In virtually every case, there will be information that the researcher or research team was not particularly looking for but which is available. Because of the effort involved in creating and launching the survey, it makes sense to fully exploit any available data that has been collected (even if that angle was not pre-planned and was not traditional). A broader approach to data analysis not only enables enriching potential captured knowledge but also the range of potential publications.
• For example, are there latent patterns of textual content in open-ended questions?
• Is there geolocational information that may identify spatial patterns? How can this be spatially mapped for clarity?
• Is there a network analysis angle? If so, what would the data matrix look like? What could be understood from the data?
• Is there a way to query the information categorically, such as based on the given demographic features of respondents? Through spatial angles?
(Different methods of querying the data will require some data processing and restructuring…and the uses of different software tools.)
Documentation
To ensure that the methods section of any publication or report is complete, it is important to document the following: the online survey system and its version; any software used and their respective versions; and all data processing and analysis processes used.
Processing Open-ended Textual Responses
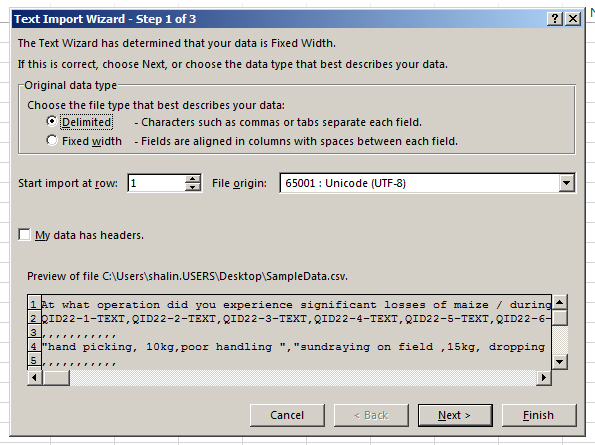
So what are some basic efficiencies in processing open-ended text responses to online survey questions? First, the downloaded textual data has to be converted into a readable format. Generally, open an Excel file, and search for “All Files.” Find the .xl or .xlsx file, and click “Open.” Excel’s “Text Import Wizard” opens.
Indicate that the file is a delimited one (because the file is a comma separated values or .csv file). Click “Next.”
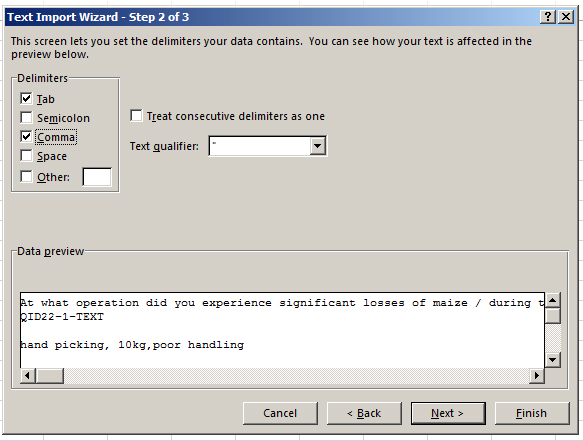
Indicate that the comma is used as a delimiter by clicking the box next to “Comma.” Make sure that the data makes sense in the “Data Preview” window. Click “Next.”
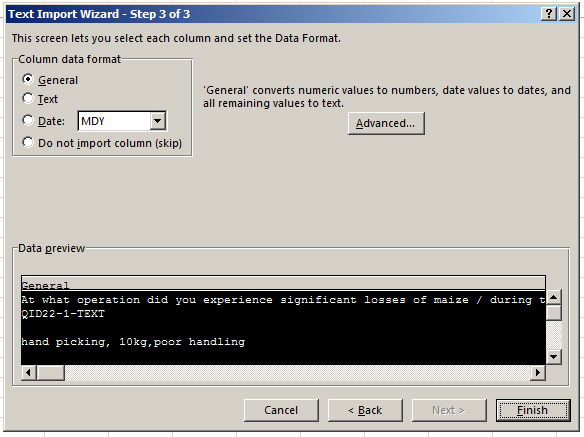
The third step in the Text Import Wizard involves defining how Excel should handle the data format. The “General” handles most common data, particularly if there is a mix of text and dates and numeric values. Click “Finish.”
Checking for Data Completeness
Glance at the data to make sure that it is all there. (Scroll down the entire column to make sure that all data has been ingested.)
Sometimes, numerical data is mis-read as a date. For example, 3 – 5 may be read as March 5. In those cases, right click the cell, and go to “Format Cells.” There, click “Number,” so the meaning reverts to a range instead of a date.
Save the Excel file using proper naming protocols (based on the standards set for the project.
Processing Textual Data in Excel
For complex multi-column data, it is often necessary to break up the data into further separate .xlsx files in order to properly sort and manage. This page addresses a unique “use case,” so the information here will be quite limited.
To extract a column, highlight the column at the top and copy all of it (CTRL + C). Open up a new Excel file, and paste all (with the A1 cell highlighted).
Erase all blank cells. Highlight the cells in A. In the Home tab in Excel, go to the Editing area. Click on Sort & Filter. Sort A to Z. Click F5. Click the Special button. Choose the radio button next to Blanks. Click “OK.” Then, click CTRL + -, and select “Shift Cells Up.” This deletes all empty cells in Excel.
Alphabetize cells. To process the mixed textual, number, and date data, first, delete the question and question label (often in Cells A1 and A2). (If this information is still needed, paste the data in to some other cells like J1 and J2).
Highlight all the cells in Column A, and copy them. Paste them into Notepad or some other text editor. (A text editor strips out the formatting of the text as well as any imagery and other elements in a text file. This enables the creation of a “lowest common denominator” text file that may be used in any number of other authoring tools and software programs.) From Notepad, copy and paste that cleaned text into Word.
A computer-assisted human frequency count. Do a search and find for the various text responses in the list. Replace the seed textual phrases and other data with blanks once they have been counted.
Create a two-column table in a separate Word file.
At the top of the left column, indicate the types of information you are collecting. At the top of the right column, put “Count.”
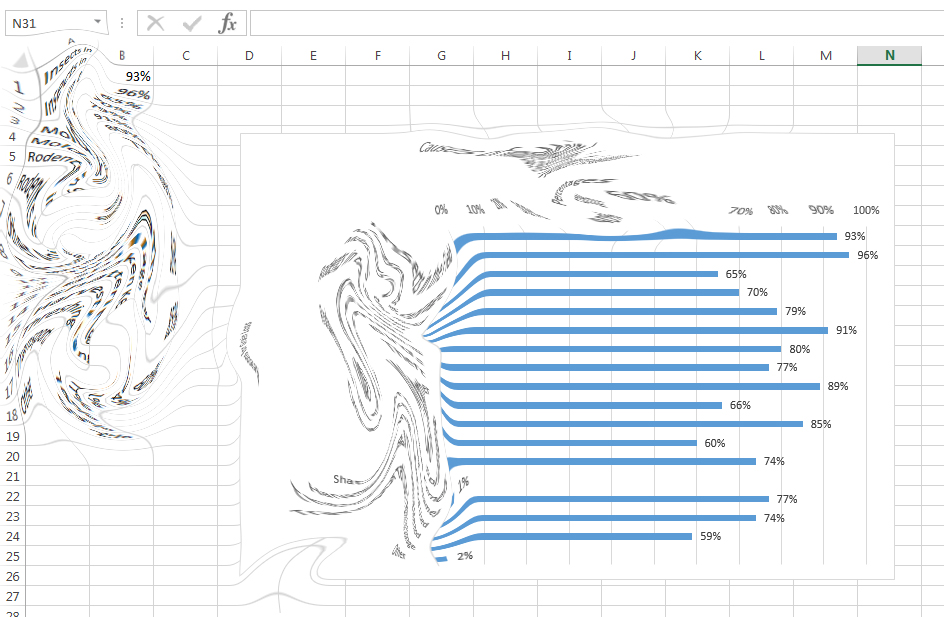
By the time you have processed the data, you have the information to create a frequency count bar chart that summarizes the responses from the survey takers for that particular question. For proper table outputs, there should be clear table labeling, clear axis labeling, uses of legends for data labeling, and so forth. Any percentages used should include raw number counts, so an actual sense of data size is clear (because percentages alone will not indicate that).
Of course, frequency data may be represented in descending order (most to least), ascending order (least to most), a bell curve structure, a power law curve, or a range of other types of representations. In the visualization above, the data was based on a sequential process.
Capturing some full quotations. While looking at the data, be sure to highlight particular textual responses that are unusual (atypical outliers), typical (representative of a typical case), original in phrasing (of human interest), ambiguous (requiring further attention later), or somehow quotable (unusual voice).
This data should be memo-ed for other insights. This data may be value-added in terms of offering context-based data for the write-up and presentations.
The quantizing of the open-ended textual responses in a frequency bar chart (in the prior step) only enables some types of insights. Having verbatim text of interest adds context and “color” to the data.
Naming Protocols (for Questions, for Files)
It is good practice to use clean naming protocols throughout. This means that a survey question should be properly labeled (Q1, Q2, Q3, let’s say), and that naming should be carried through for all files that are used for the processing of the data (all .csv, .xlsx, .doc, .docx, and others). Further, the file name should have semantic meaning to label what the question is about. This makes it easier when back-tracking to understand why a certain result was extracted from the data. It also helps when troubleshooting anomalous results and correcting any possible mis-coding.
| Previous page on path | "Using NVivo" Cover, page 46 of 58 | Next page on path |
Discussion of "Processing Qualitative Text Responses from Online Survey Data (with Excel)"
Add your voice to this discussion.
Checking your signed in status ...