"Using NVivo" Cover
This electronic book is a basic primer on the use of NVivo (a qualitative and mixed methods data analysis software tool). NVivo is part of the Computer-Assisted Qualitative Data Analysis Software (CAQDAS) category of software tools.
"Using NVivo: An Unofficial and Unauthorized Primer" is presented from a user viewpoint in order to make the software tool more approachable. This is especially important given the additional capabilities of recent versions of NVivo (with some machine learning, with social media integrations, with integrations with Qualtrics and Survey Monkey, and with fresh data visualization capabilities).
While NVivo is considered state-of-the-art in its type and class, it also has a reputation for complexity and challenge. The learning curve for this tool is non-trivial; however, it is not deserving of the reputation of insurmountable difficulty. It helps to think about the software tool based on its essential functionalities:
- (multimedia) data and metadata management
- multimodal data curation
- data "cleaning" (through coding, or through pre-processing)
- mass uploads of interview, focus group, and online survey data (including with classification sheets to integrate demographic and other data to each respondent, if available)
- integrations with third-party tools (online surveys, bibliometric tools, social media, email systems)
- (manual and automated) coding and annotation of multimodal data;
- creation of codebooks
- varied and complex data queries (save-able as macros for repeatability)
- native data visualizations
- statistical similarity analyses (Kappa coefficient; consensus measures; dissensus measures)
- automated emulation of human coding (at scale)
- multi-team coding and collaboration
- social media data extractions with NCapture
- Twitter (microblogging site)
- Facebook (social networking site)
- YouTube (video links)
- web pages (not advisable* because of performance and size of files; print to pdf preferred)
- and others...
While the projects are proprietary (and require ownership or subscription to the software), the exports of data tables, data visualizations, codebooks, reports, and other elements are in eminently readable file types. There is also an integration with SPSS (so NVivo can take .sav datasets, and it can export data tables as .sav files).
Electronic text navigation. This publication may be navigated sequentially, from this Cover (index page). This is the long and sequential path, with small side excursions enabled by links. It may be navigated piecemeal from the left menu Table of Contents based on whatever the reader wants to explore. The data visualization of this page is also navigable, by clicking on a particular page node or path.
A State-of-the-Art Qualitative and Mixed Methods Data Analysis Software
(Note: The Google Books Ngram Viewer shows the popularization of the term "NVivo" in books. The Ngram Viewer captures "ngrams" within its tens of millions of digitized books' text corpuses.)
A bit about NVivo. The name "NVivo" apparently comes from the term “in vivo,” which means “within the living” or "within the body" in Latin, as opposed to “in vitro,” which means “in glass” in Latin, which refers to research in labs.
The in vivo aspect points to the study of various phenomena among the living in a more natural setting than empirical science-based benchtop research. The in vivo suggests "natural" experiments that happen in-world.
Qualitative research, as opposed to the classic quantitative research, is built on a different theoretical basis than quantitative research. Currently, much research draws from both traditions, for mixed methods (synthesized methodology from qualitative and quantitative traditions) or multi-methods research (combinatorial methodology with discrete research methods for different parts of the research, often over time). [NVivo, in a prior incarnation, was known as NUD*IST (Non-numerical Unstructured Data Indexing, Searching, and Theorizing). This software tool was created by Tom Richards in 1999. Over the years, it has gone through a number of incarnations. More on NVivo is available on its Wikipedia page.].
NVivo's core version is designed for a Windows operating system. In mid-2014, it released a native Mac OS version; this version is a somewhat limited one and does not have the full multimedia incorporation and data analytics capabilities of the Windows version. Recently, QSR International has released capabilities to enable researchers to save out a project from the Windows version (.nvp) to one readable by the NVivo for Mac version (.nvpx). A Windows version of NVivo can simply open a .nvpx version--at which time the user will be asked to convert the file to the .nvp version. For more on this, go to the bottom of "The NVivo User Interface" page.
Software adoption. NVivo is not a tool that is appropriate for all projects. (There is a section titled "To Go with NVivo or Not" which may be helpful in the decision.) Rather, each researcher has to do his or her own due diligence to consider what software products are available and how well they will fit to the needs of the research.
Notes to Readers
Accessing images. Allow time for the images to populate into the page. These were ingested in a way as to be enlarged when "Details" is clicked on at the bottom right of each image.
Why the Scalar platform? Scalar is an open-source e-publication platform. The makers of Scalar have a stated ambition of wanting to bring together scholars to analyze contents of various open repositories that are hosted on the Web. The technological understructure supports the building of publications in a way that is aligned with the Semantic Web. (You will see this in the ability to define various paths through the contents and the various interrelationships. You will see this also in the tagging and annotating features related to contents; this addition of metadata enables more coherent machine acquisition of semantic information from the Web. There are embedded video players that enable the framing of contents from a number of online repositories, including YouTube, Vimeo, SoundCloud, Prezi, Getty Museum Collection, the Metropolitan Museum of Art, and others. The dynamic data visualizations of the text are a built-in feature of Scalar.) This e-book resides on the site hosted by the University of Southern California. This platform has tools for community building, work collaboration, and other features as well.
No "fixed" .pdf version at this time. Per the request for a .pdf version of this e-book, Scalar leadership have said that they see the online resources as interactive and dynamic. A manually created version of this text would be non-trivial in terms of typography and layout. Each page currently can be printed out as a .pdf from the browser. Sorry if this approach causes problems for anyone.
The text itself is not in final form. NVivo is a complex tool with a wide range of functionalities and features. The learning curve for this tool is fairly high. Until the text has reached a state of "equilibrium," it would not make sense to freeze the format.
Commenting on pages: A few comments have been left on this book. The first one did not receive a response in a timely fashion, but future ones will, now that the author will be notified automatically once a comment has been sent. Comments do not appear automatically and must be approved to show.
Suggestions for improvement welcome. This is a draft e-book written over a couple-week period in September 2014. The speed-drafting meant that this was developed in an agile but clumsy way. Some typos have been corrected since. If you have suggestions for improvement or see mistakes, please contact the author through the email on the Author page.
Disclaimer. The author has no tie to QSR International, the maker of NVivo.
Caveats about using this text and software: Those who use this book should already have the following:
- basic knowledge of qualitative research, mixed methods research, and multi-method research
- ability to code in a top-down or bottom-up or combined approach (including from the usage of others' codebooks)
- ability to create an original codebook based on theory, modeling, frameworks, or other approaches in a top-down way...or a bottom-up method based on research
It is ill-advised to go straight from a research proposal to machine learning to try to get right to outcomes. Human coding and autocoding generally diverge (the coding does not generally converge). Please move past a sense of the "magic" of software before using this tool for any serious research, whether for master's theses, doctoral dissertations, or publishing.
Please use a variety of sources for learning about the software. Please start with the fundamentals. (Please do not make assertions using the tool until you're fairly confident in your usage of the tool.)
Faculty who point their students to this book should know the software backwards and forwards in order to support their own students.
No access to the software through this e-book: A few have contacted the author requesting access to the software. The software itself is proprietary and must be commercially licensed to use. No unauthorized access will be enabled for any who ask. (QSR International does have a low-cost student version for about $100 per year of subscription, and this version is fully functioning, without any programmed limitations.)
Two installations per license: For NVivo, two versions may be installed on two computers at any one time. If one of the licenses has to be moved, one is supposed to de-activate one of the licenses...so that the software can be installed on another machine. Neither of the author's two versions allows deactivation from the software [File -> Help -> Manage License.] The author had to reach out to a QSR International staff member to enable the move.
CAQDAS: Interested in Computational Qualitative Data Analytics? Here is a summary slideshow created in mid-2022: https://www.slideshare.net/ShalinHaiJew/computational-qualitative-data-analytics
Begin this path: "Using NVivo" Cover
- Intro
- What is NVivo?
- A Research Workflow with NVivo Integrations
- Downloading, Installing, and Registering the Software
- The NVivo User Interface
- Starting a New NVivo Project
- Opening (and Converting) an Existing NVivo Project
- Starting a Multilingual Project
- Research Journaling in NVivo
- Ingesting "Internal" Source Contents
- Ingesting "External" Source Contents (Think "Proxy")
- NCapture and the Web, YouTube, and Social Media
- Analyzing Social Media Data in NVivo
- Manual Coding in NVivo
- Exporting Code Categories (Nodes) for Close-in Analysis
- Coding (Social) Imagery in NVivo
- Coding Audio and Video in NVivo
- Creating Relationships between Project Items (Nodes, Sources, and Other Entities)
- Creating Case Nodes
- Creating Codebooks in NVivo (through Reports...through Share)
- Conducting Data Queries in NVivo (Part 1 of 2)
- Conducting Data Queries... (Part 2 of 2)
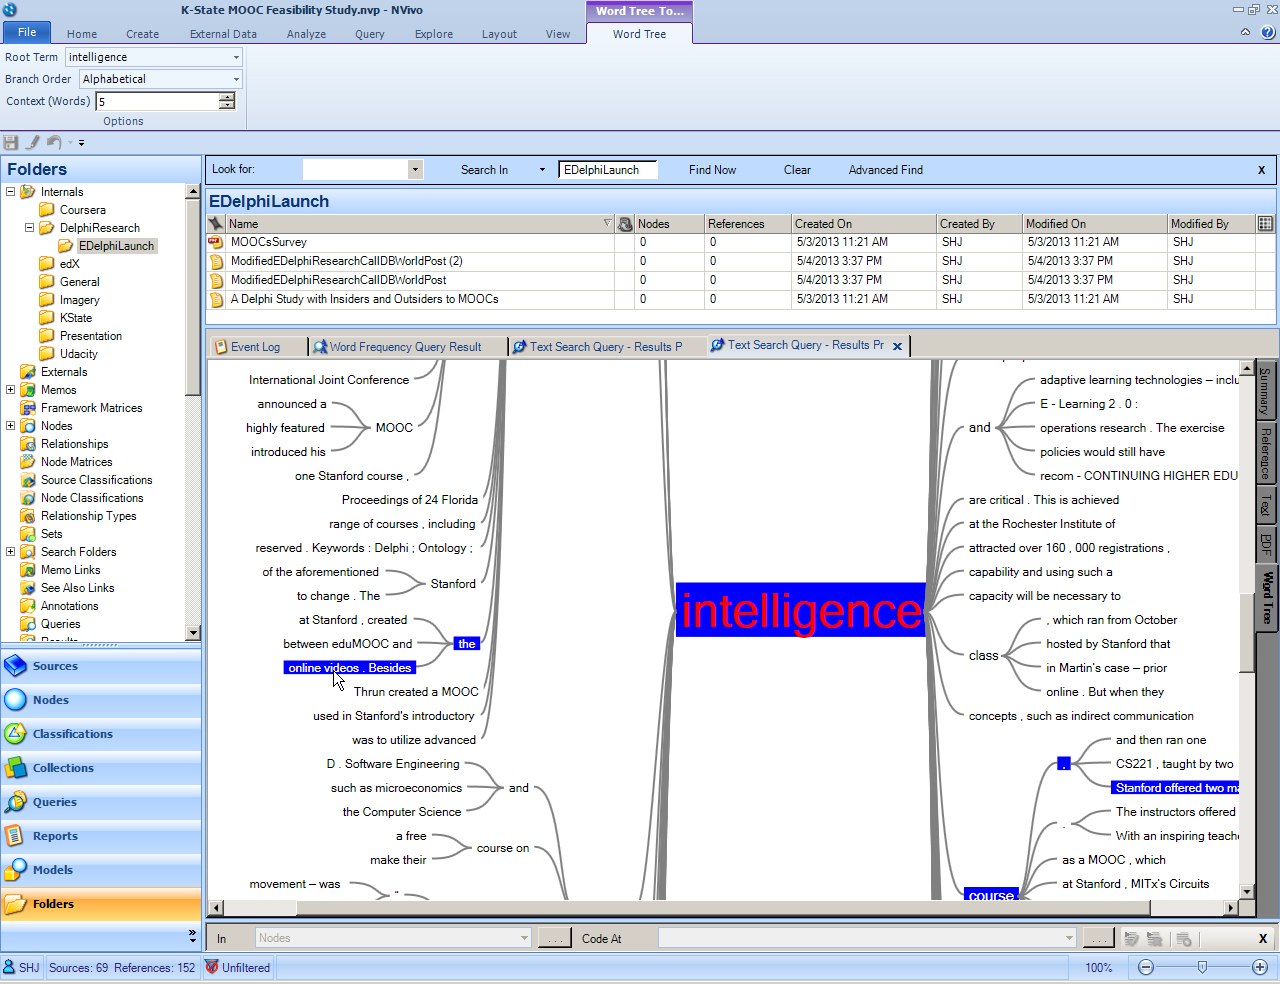
- Data Query: Text Search Query
- Data Query: Word Frequency Count Query
- Data Query: Coding Query
- Data Query: Matrix Coding Query
- Data Query: Coding Comparison (Advanced) and Cohen's Kappa Coefficient
- Data Query: (Qualitative) Crosstab Query
- Data Query: Compound Query (Advanced)
- Data Query: Group Query (Advanced)
- Using Demographics to Further Explore Interview, Survey, or Focus Group Data
- Creating Framework Matrices from Case Nodes and Theme Nodes
- Creating Network Sociograms (Social Network Graphs)
- Creating a New (Node or Source) Classification Sheet with Ingested Data
- Some Types of Data Visualizations in NVivo
- Data Visualizations in the Active Details Pane in NVivo
- Disambiguating Data Visualizations
- "Autocoding" through Styled or Sequentially-Structured Textual Data
- "Autocoding" through Machine Learning from Existing (Human) Coding Patterns
- “Autocoding” through Sentiment Extraction and Analysis
- "Autocoding" through Theme and Sub-theme Extraction
- "Autocoding" by Speaker Name
- Sequential Explorations
- Qualtrics Integration with NVivo (in Windows)
- Importing a Survey into NVivo Using a Microsoft Excel File
- Processing Qualitative Text Responses from Online Survey Data (with Excel)
- Team or Group Coding in NVivo
- Drawing Relational Models
- Building and Exporting Reports
- Citing Published and Unpublished Sources in NVivo
- Use Case: Using NVivo for Literature Reviews
- Use Case: Using NVivo for Social Network Profilings
- To Go with NVivo or Not? (and Partial Checklist for Stopping Usage of NVivo)
- Future Look: Data Repositories for NVivo-based Data Sets?
- An Online Community of Users and Additional Resources
- (Partial) Glossary of Terms
- References
- Some "Wants" re: NVivo
- Author Intro
Discussion of "'Using NVivo' Cover"
Add your voice to this discussion.
Checking your signed in status ...