Drawing Relational Models
The Model feature in NVivo may be used at any point in a research project. Prior to any research, a researcher or research team may begin to express their hypothesis or question in a visual form. This is conceptualized as a tool for manual mind-mapping as well as providing visualizations of ideas for other uses (like publications and presentations). During the project, a researcher may create models manually and with the nodes and contents from the research. At any point, these visualizations may be exported for internal (or external) analysis, presentations, or publications. These models may be maintained in a static form at various points to show the progression of understandings over time.
These models are basically 2D node-link (vertex-edge) graphs. They may be called "relational" models because they depict entities and relationships in a structural ("morphological" for the term-of-art) way. Within the structure are implied processes and dynamics. A model's power is in its parsimonious insights about its various "mechanisms"--how the particular represented systems function and its components interact and interrelate (internally) and possibly how this system responds to from-outside factors.
These models may depict any of the following relationships (and then some):
These models may be manually created or auto-created based on the ingested data and the coding of that data. (If the workspace becomes too limited, it is possible to export the contents (copy all and paste) into Microsoft Visio, which enables much more complex static visual / relational modeling.)
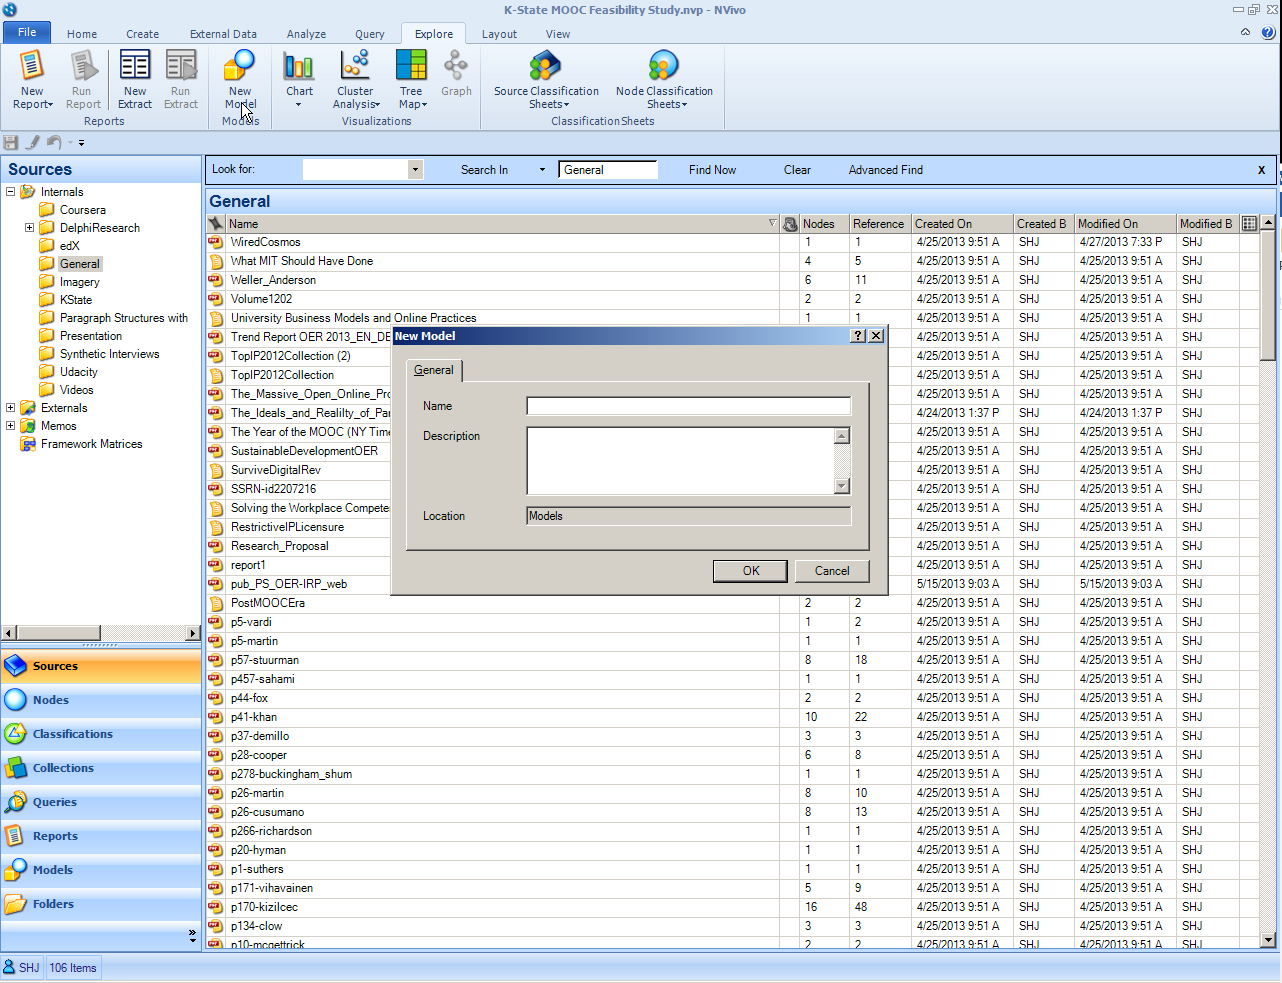
In the NVivo ribbon, go to the Explore tab. Click New Model.
The New Model window opens.
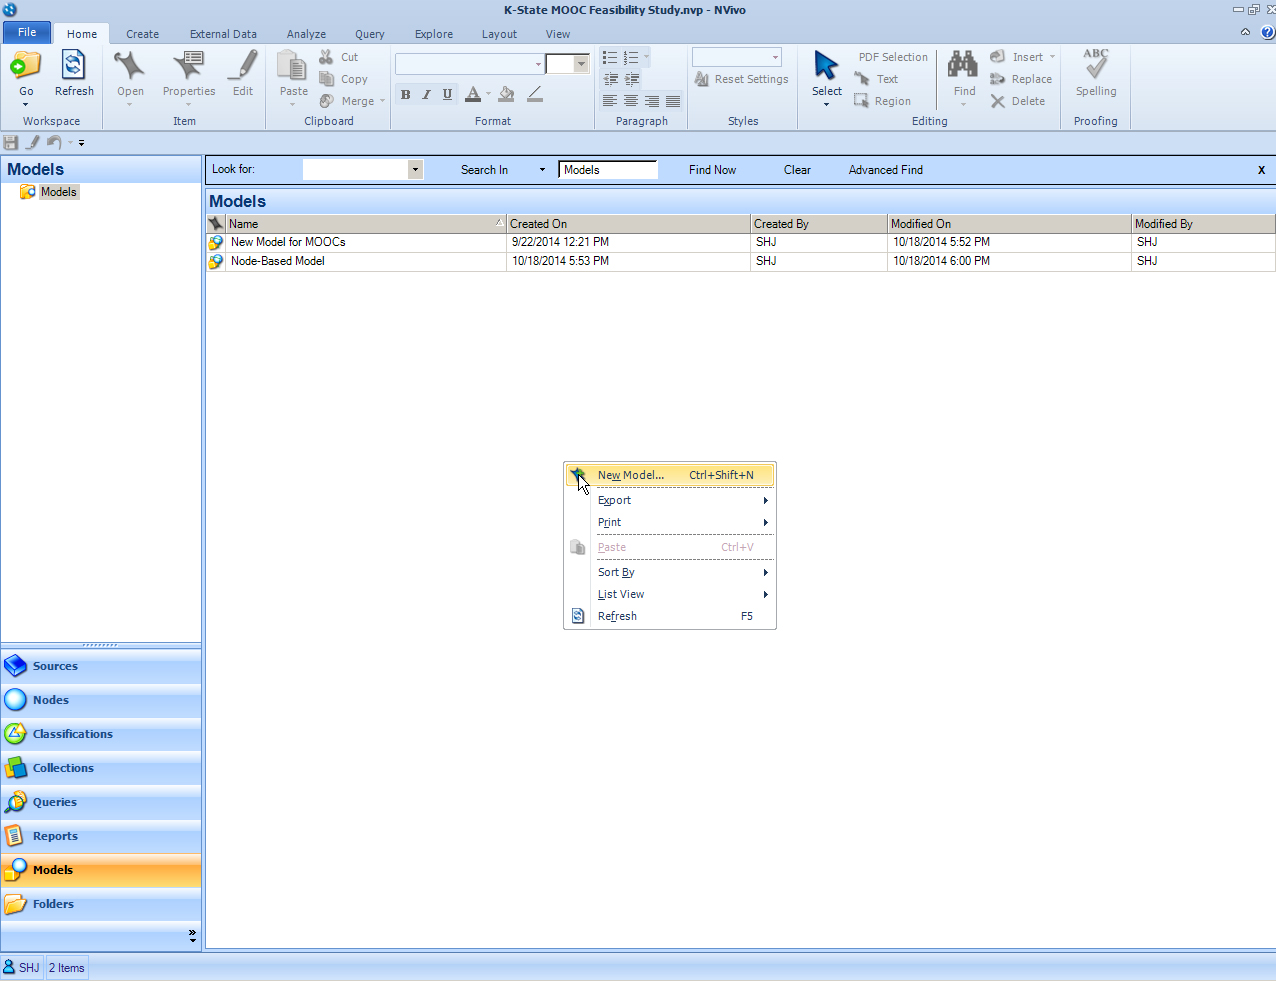
Another way to start a New Model is to click on “Models” in the Navigation View (at the bottom left of the workspace). Right click in the List View area. Click “New Model” in the dropdown menu.
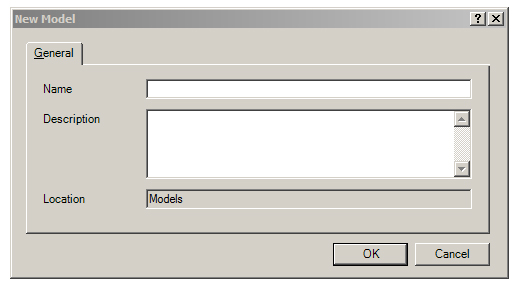
The “New Model” window opens. Input the Name of the new model and the Description.
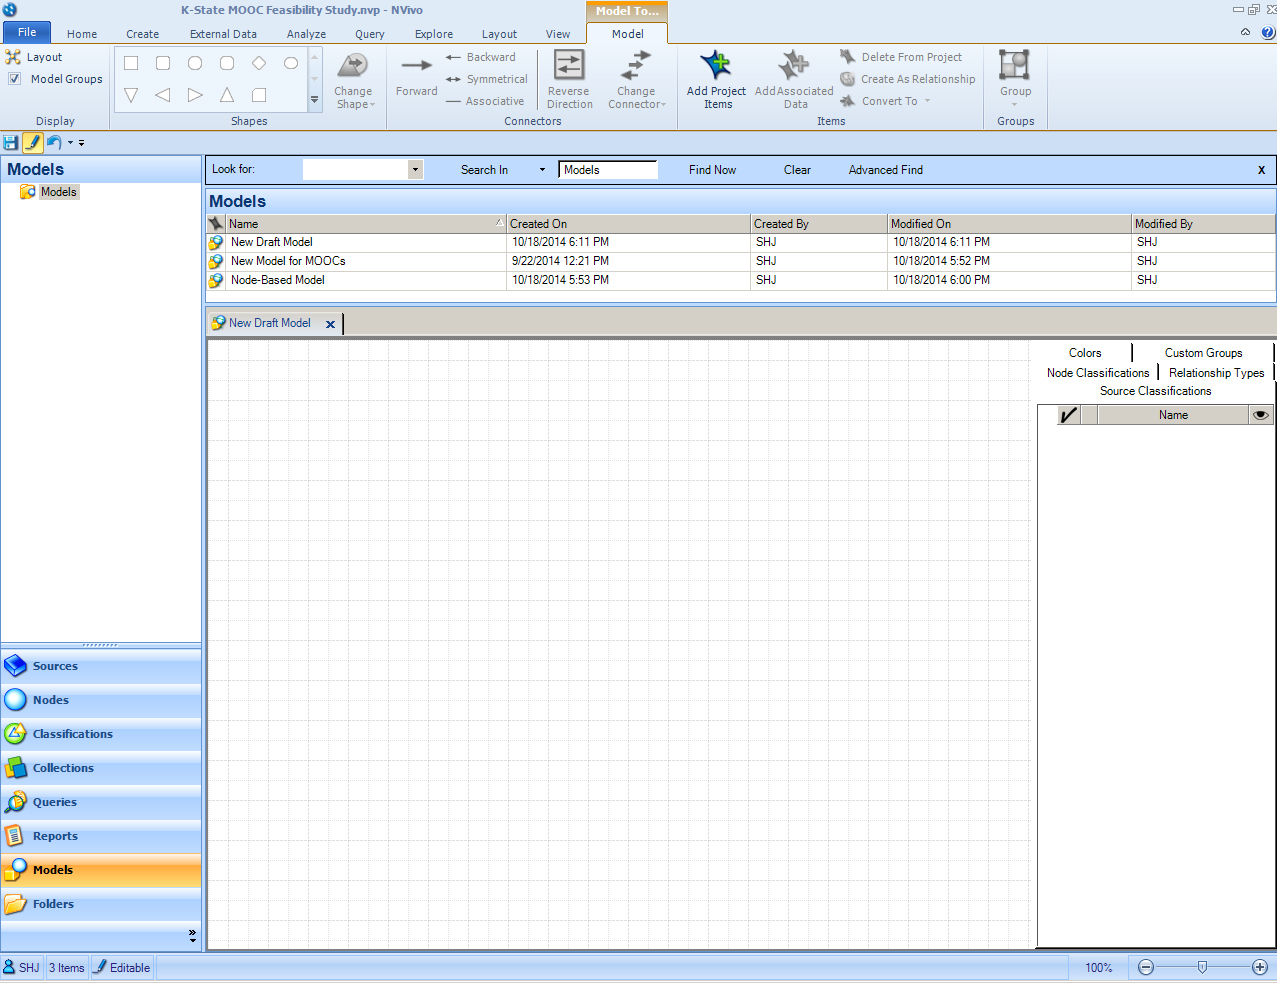
Click “OK”. A new workspace opens. The model workspace consists of a grid to the left and a “Model Groups Pane” to the right.
This right pane may be disappeared for more workspace by clicking at the top left part of the ribbon in the Display group where it says “Model Groups.” (If the box is checked, the Model Groups Pane is visible; if unchecked, the Model Groups Pane disappears.)
The Model Groups pane provides two main functions: an “include” function and a “visibility” function. This enables a researcher to “filter” to “show, hide, or select multiple items” in a model. These items that may be made visible or invisible include the following: source classifications and attribute values, node classifications and attribute values, relationship types, assigned colors, and custom groups. This feature enables the building of more complex visualizations that are still navigable because of the ability to hide particular elements in order to focus on particular parts. (For more on this feature, please click this link for “Use groups to show or hide items in a model.”)
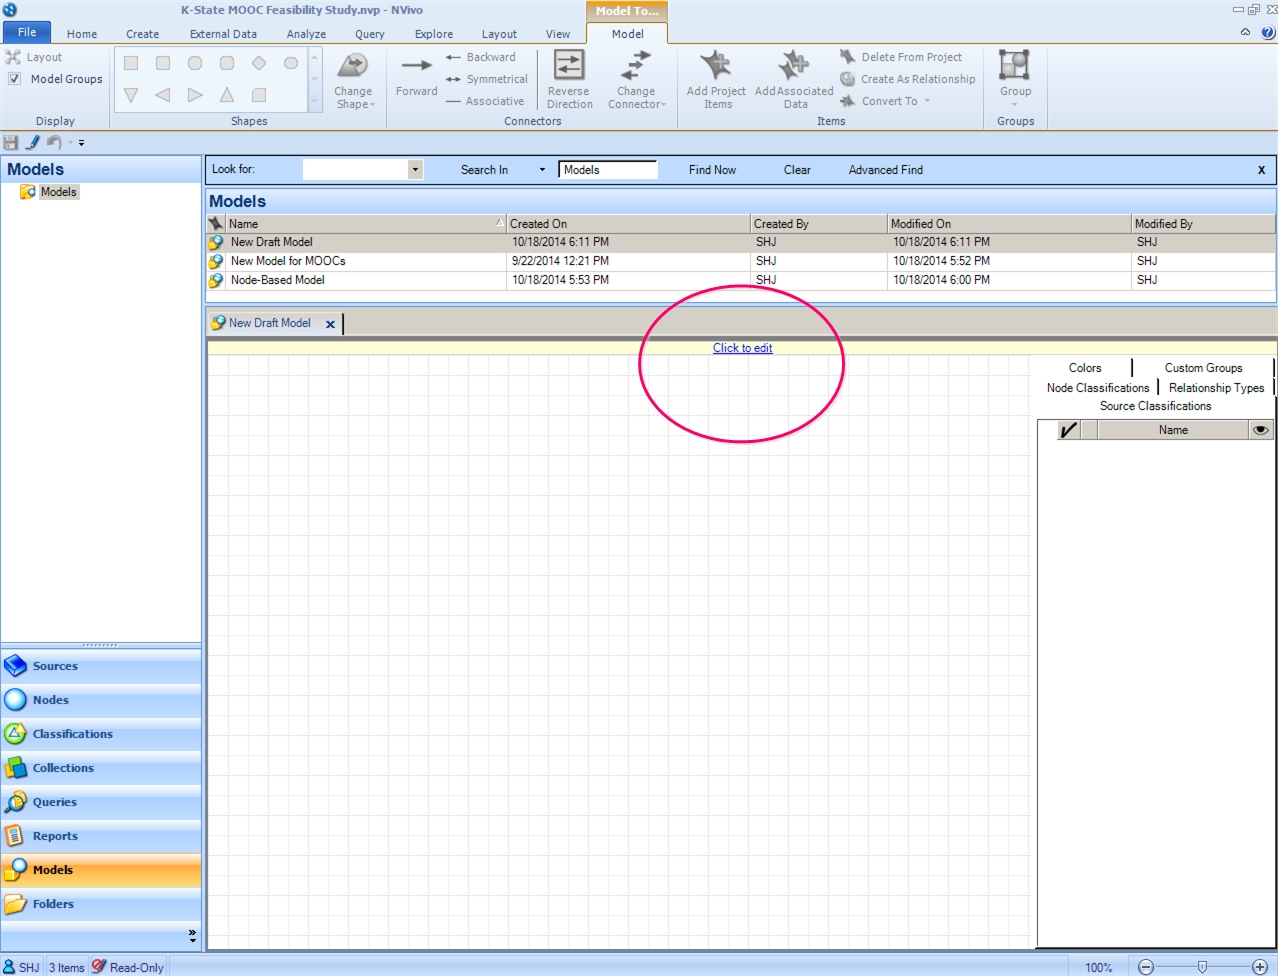
At the moment of creation, a model workspace may be edited right away, without any change. However, if a researcher has clicked around to another space, then to be able to edit, he or she has to click on “Click to edit.” (This command takes the model out of “static mode” and puts the model into “edit mode.”
Once activated, the model space is ready for drawing.
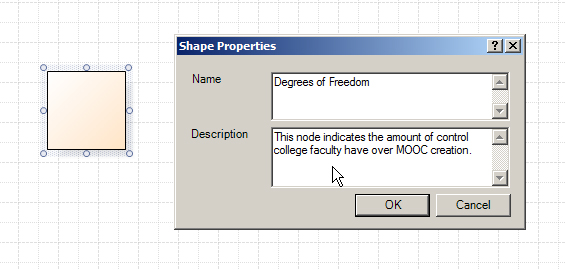
A researcher may create models manually by using the shapes in the ribbon by clicking on the desired shape in the Shapes group. By right-clicking on the shape, a researcher may add a name and a description to the object as “Shape Properties.” Click OK.
Other such shapes may be added in the same way.
To connect related nodes, click on the selected originating node, hold CTRL, and click a second node. Then, in the Connectors group, click Forward or Backward or Symmetrical or Associative…to show the connection. If multiple connections are desired, then it is important to click further nodes and repeat the process.
If a researcher wants to add further definition to the connection, he or she may double-click the arrow and type in a textual descriptor for that relationship. Multiple relationships may be difficult to portray because of overlapping text (although changing the shape size may sometimes make text legible. .
As the model’s size changes, horizontal and vertical scroll bars will appear to enable navigability.
Another option involves using extant coded nodes and ingested sources for a model. Basically, once a new model has been started, a researcher may do the following:
Model -> Add Project Items
In the Select Project Items window, he or she may select what to include.
These objects that are brought in are circular and indicated by a signature blue node for nodes and the iconic other-indicators for different source types. The glyph representing a model object based on a node may be right-clicked to “Project Item Properties” to read more about the original node. With a right-click, a researcher may add associated data and so forth as well.
Pre-existent structures and relationships may be expressed in this type of modeling.
There are some built-in ways that contents may be laid out. In the Model tab, at the far left, in the Display grouping, there is the “Layout” option, which enables a selection of Circular, Directed, Hierarchical, and Orthogonal layout. (Certain types of layouts apply to certain types of data. Discussion of this is well beyond the purview of this basic primer.)
Start a new model (per either of the two methods described above). For this example, a node will be “graphed” in order to visualize its relationships. Click into the model so that it is activated.
In the NVivo ribbon, go to the Explore tab.
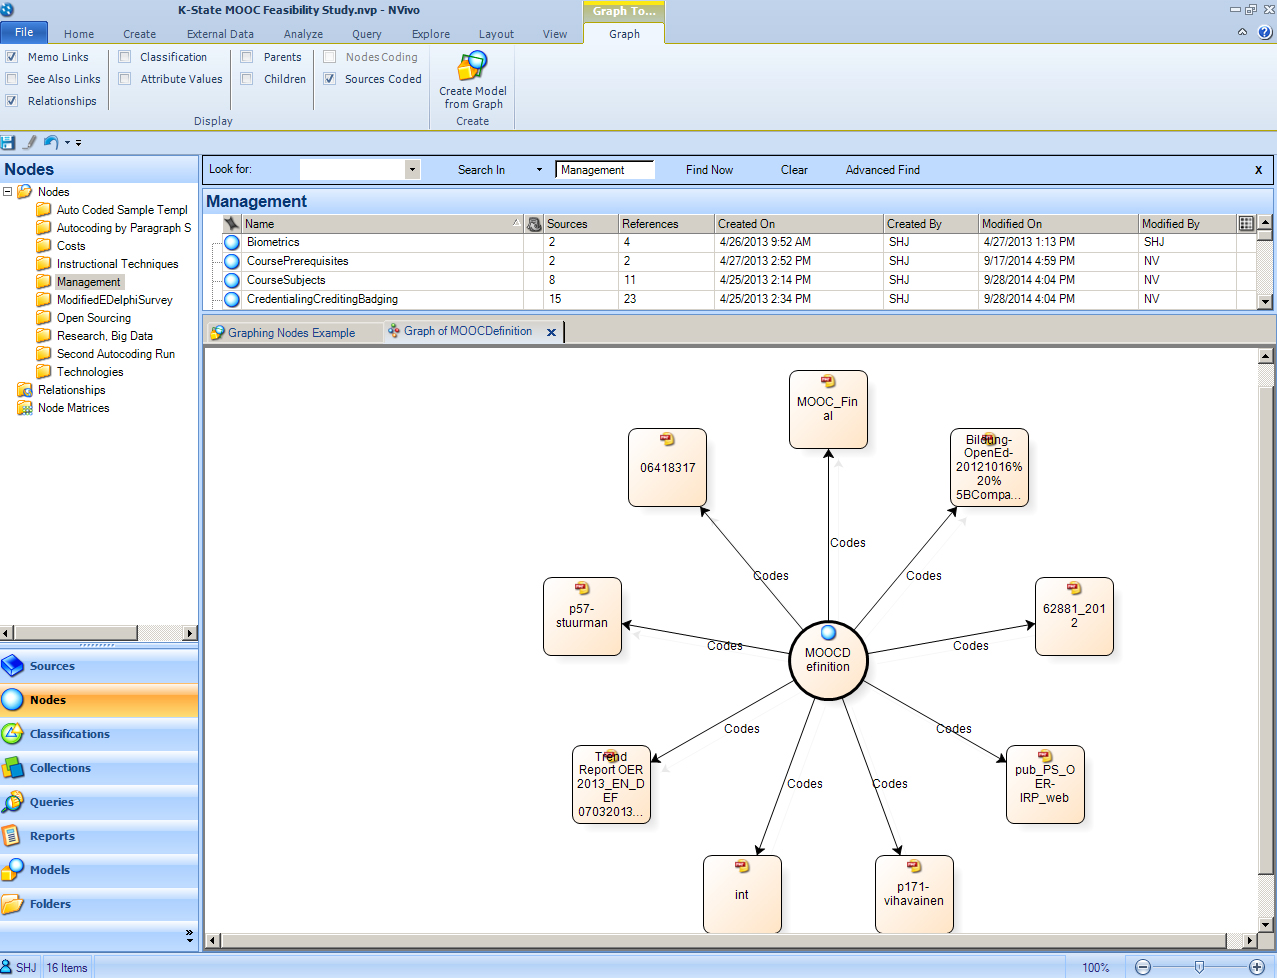
In the Nodes folder in the Navigation View, select the desired node in the List View. Click “Graph” in the Visualizations group in the ribbon.
The relationship types for the particular node will be displayed. The relationships may be in various forms—such as the coding relationships. The manual relationships created will also be indicated if those were created prior.
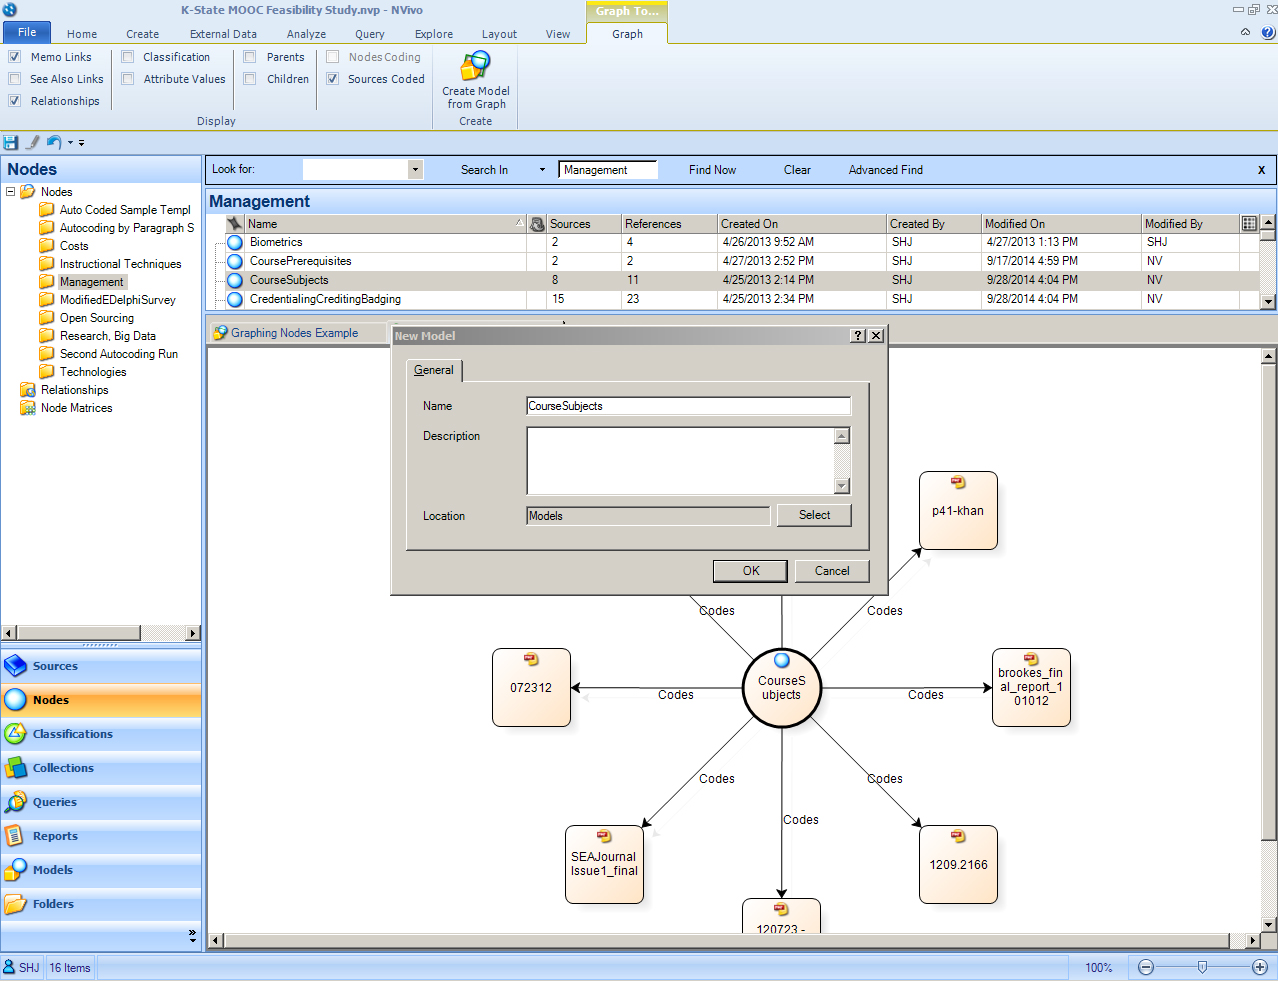
To save the visualization as a model, go to the Graph tab in the NVivo ribbon. Click “Create Model from Graph” in the Create group. Name the new model, and add a Description.
The models are all exportable. In the workspace, right-click and in the dropdown menu, click “Export Graph.” The options are as .jpg, .bmp, .gif, or .svg.
Some current terms-of-art describing human-created models includes the following: knowledge engineering, rational modeling, and cognitive modeling. These terms refer to human immersion in a target construct (through research and observation), fully studying the data, understanding relevant theories, and creating a model. Various research and analytical methods have been defined in respective fields to mitigate for some of the human limitation risks in knowledge engineering of models.
These models are basically 2D node-link (vertex-edge) graphs. They may be called "relational" models because they depict entities and relationships in a structural ("morphological" for the term-of-art) way. Within the structure are implied processes and dynamics. A model's power is in its parsimonious insights about its various "mechanisms"--how the particular represented systems function and its components interact and interrelate (internally) and possibly how this system responds to from-outside factors.
These models may depict any of the following relationships (and then some):
- associational relationships
- causal relationships
- categorical (typology-based) relationships
- geographical relationships
- sequences or phenomena over time (backwards or forwards or synchronously)
- hierarchical relationships
- ontologies, and others
These models may be manually created or auto-created based on the ingested data and the coding of that data. (If the workspace becomes too limited, it is possible to export the contents (copy all and paste) into Microsoft Visio, which enables much more complex static visual / relational modeling.)
Starting a New Model
In the NVivo ribbon, go to the Explore tab. Click New Model.
The New Model window opens.
Another way to start a New Model is to click on “Models” in the Navigation View (at the bottom left of the workspace). Right click in the List View area. Click “New Model” in the dropdown menu.
The “New Model” window opens. Input the Name of the new model and the Description.
Click “OK”. A new workspace opens. The model workspace consists of a grid to the left and a “Model Groups Pane” to the right.
This right pane may be disappeared for more workspace by clicking at the top left part of the ribbon in the Display group where it says “Model Groups.” (If the box is checked, the Model Groups Pane is visible; if unchecked, the Model Groups Pane disappears.)
The Model Groups pane provides two main functions: an “include” function and a “visibility” function. This enables a researcher to “filter” to “show, hide, or select multiple items” in a model. These items that may be made visible or invisible include the following: source classifications and attribute values, node classifications and attribute values, relationship types, assigned colors, and custom groups. This feature enables the building of more complex visualizations that are still navigable because of the ability to hide particular elements in order to focus on particular parts. (For more on this feature, please click this link for “Use groups to show or hide items in a model.”)
At the moment of creation, a model workspace may be edited right away, without any change. However, if a researcher has clicked around to another space, then to be able to edit, he or she has to click on “Click to edit.” (This command takes the model out of “static mode” and puts the model into “edit mode.”
Once activated, the model space is ready for drawing.
A researcher may create models manually by using the shapes in the ribbon by clicking on the desired shape in the Shapes group. By right-clicking on the shape, a researcher may add a name and a description to the object as “Shape Properties.” Click OK.
Other such shapes may be added in the same way.
To connect related nodes, click on the selected originating node, hold CTRL, and click a second node. Then, in the Connectors group, click Forward or Backward or Symmetrical or Associative…to show the connection. If multiple connections are desired, then it is important to click further nodes and repeat the process.
If a researcher wants to add further definition to the connection, he or she may double-click the arrow and type in a textual descriptor for that relationship. Multiple relationships may be difficult to portray because of overlapping text (although changing the shape size may sometimes make text legible. .
As the model’s size changes, horizontal and vertical scroll bars will appear to enable navigability.
Accessing Nodes and Sources for a Model
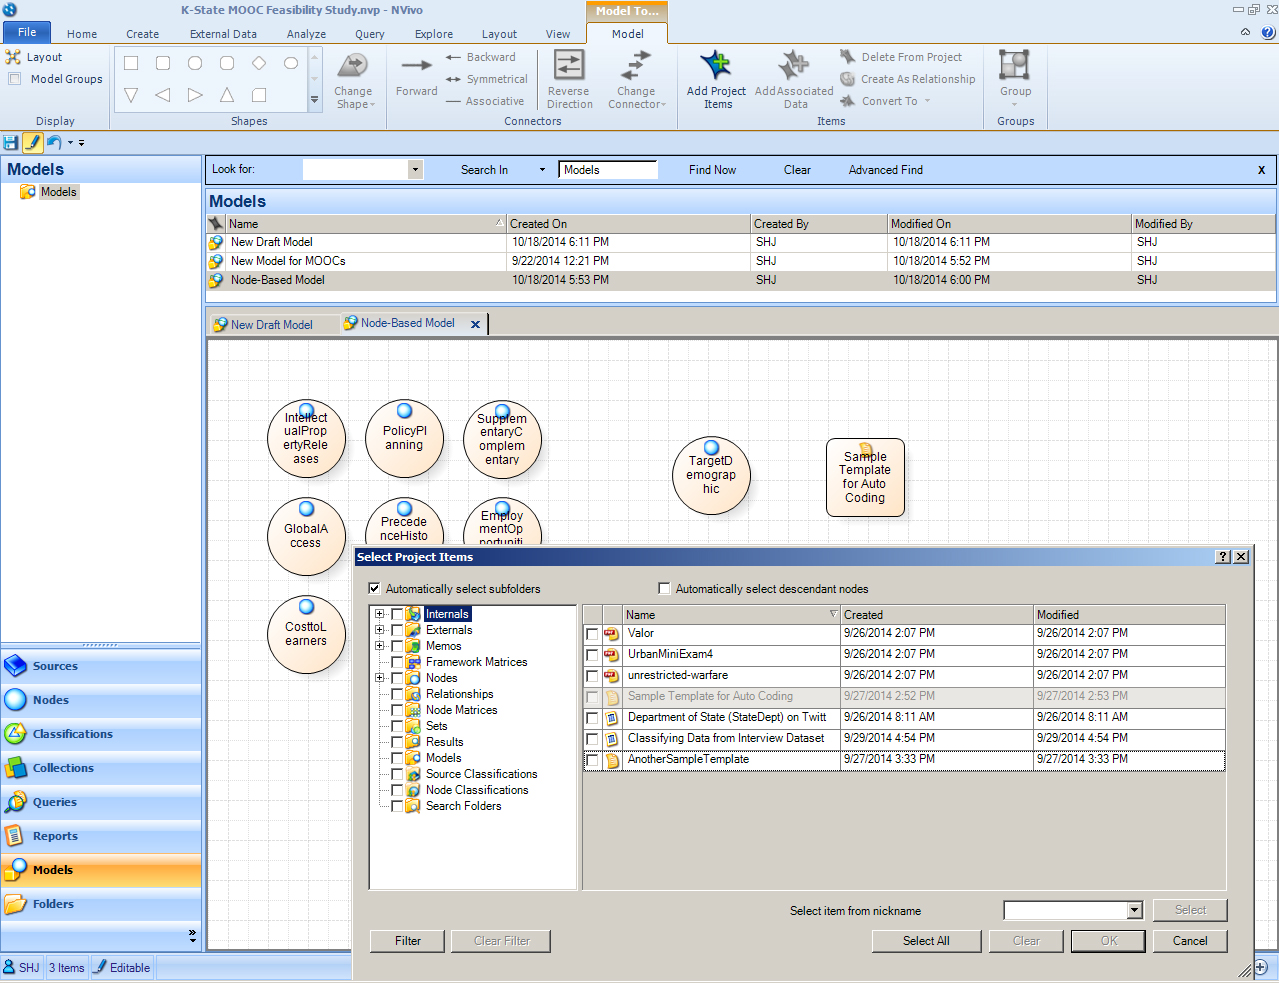
Another option involves using extant coded nodes and ingested sources for a model. Basically, once a new model has been started, a researcher may do the following:
Model -> Add Project Items
In the Select Project Items window, he or she may select what to include.
These objects that are brought in are circular and indicated by a signature blue node for nodes and the iconic other-indicators for different source types. The glyph representing a model object based on a node may be right-clicked to “Project Item Properties” to read more about the original node. With a right-click, a researcher may add associated data and so forth as well.
Pre-existent structures and relationships may be expressed in this type of modeling.
There are some built-in ways that contents may be laid out. In the Model tab, at the far left, in the Display grouping, there is the “Layout” option, which enables a selection of Circular, Directed, Hierarchical, and Orthogonal layout. (Certain types of layouts apply to certain types of data. Discussion of this is well beyond the purview of this basic primer.)
Graphing Node or Source Information
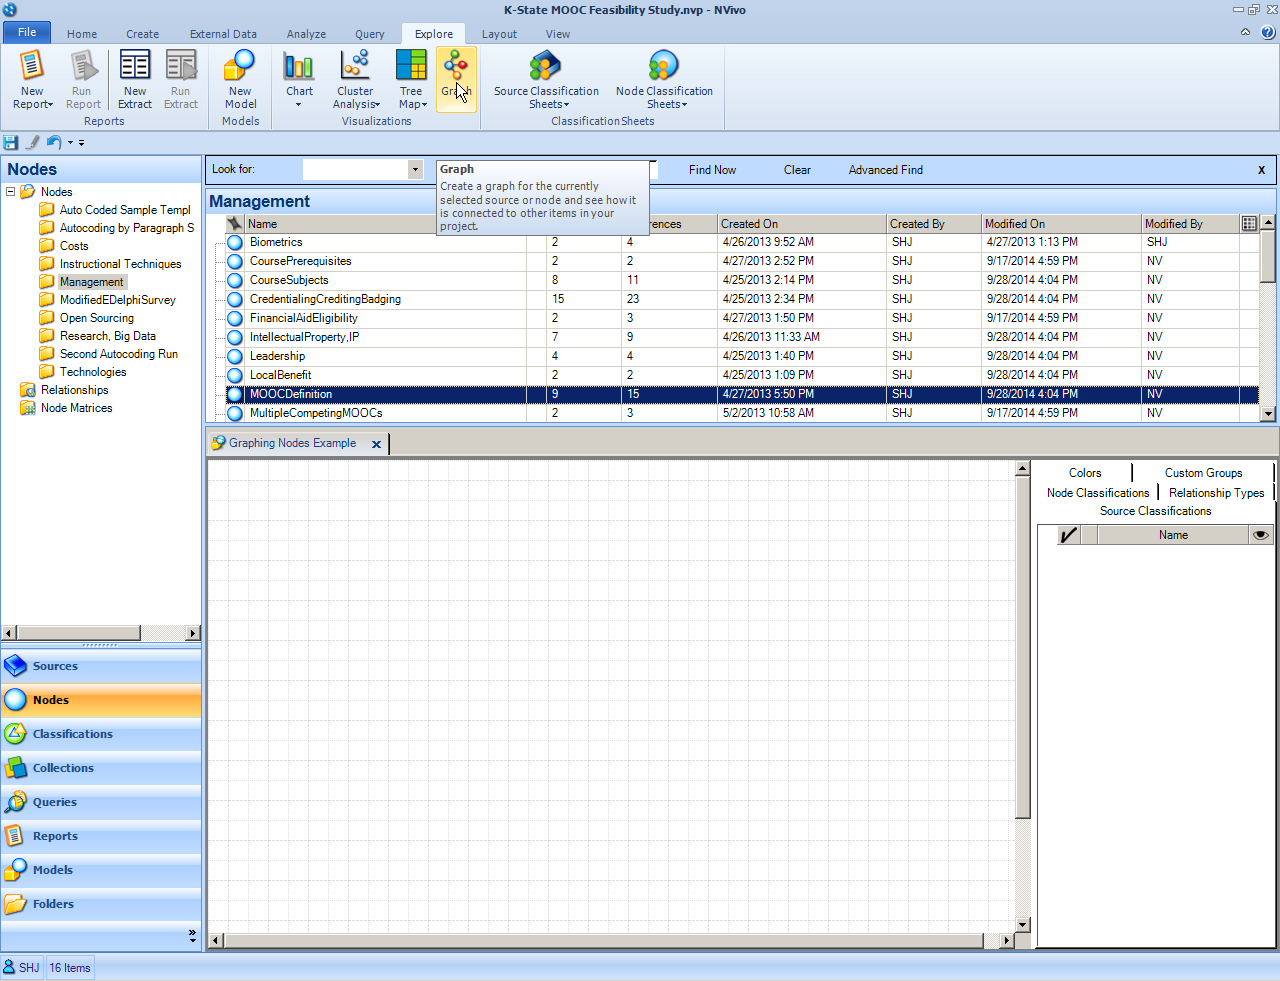
Start a new model (per either of the two methods described above). For this example, a node will be “graphed” in order to visualize its relationships. Click into the model so that it is activated.
In the NVivo ribbon, go to the Explore tab.
In the Nodes folder in the Navigation View, select the desired node in the List View. Click “Graph” in the Visualizations group in the ribbon.
The relationship types for the particular node will be displayed. The relationships may be in various forms—such as the coding relationships. The manual relationships created will also be indicated if those were created prior.
To save the visualization as a model, go to the Graph tab in the NVivo ribbon. Click “Create Model from Graph” in the Create group. Name the new model, and add a Description.
Exporting a Model as an Image
The models are all exportable. In the workspace, right-click and in the dropdown menu, click “Export Graph.” The options are as .jpg, .bmp, .gif, or .svg.
Redrawing Imagery Outside NVivo
In many cases, other software tools may offer more visual range and aesthetics than NVivo. In such cases, the original data tables may be exported, with data visuals drawn in Excel, for example. Or the models may be exported as visuals and redrawn in Microsoft Visio Professional or Adobe Illustrator or animated with Adobe Animate (formerly Flash Professional). There are numerous options for visualizing effectively, even if NVivo is used as the original tool for conceptualizing the visualized ideas.
Knowledge Engineering / Rational Modeling / Cognitive Modeling
Some current terms-of-art describing human-created models includes the following: knowledge engineering, rational modeling, and cognitive modeling. These terms refer to human immersion in a target construct (through research and observation), fully studying the data, understanding relevant theories, and creating a model. Various research and analytical methods have been defined in respective fields to mitigate for some of the human limitation risks in knowledge engineering of models.
| Previous page on path | "Using NVivo" Cover, page 48 of 58 | Next page on path |
Discussion of "Drawing Relational Models"
Add your voice to this discussion.
Checking your signed in status ...