Coding (Social) Imagery in NVivo
There are various types of research that may include imagery data: maps, figures, photos, drawings, digital image scans, video stills (aka screen grabs) and others. In some cases, some research may be focused solely around image sets. Of late, what has been quite popular has been the study of social imagery—from image-sharing social media platforms, microblogging sites, social networking sites, and others. Social media imagery has been purposefully shared to the broad public in the spirit of the Social Web (Web 2.0). This page lightly describes the use of NVivo 11 Plus for one such project.
The General Sequence
To broadly over-simplify, an image analysis may proceed through the following steps:
- Image collection (including through web browser add-ons)
- Image processing
- Renaming the images
- Recoding imagery so they are of a file type
- Correction of image rotation
- Writing descriptions of the image (annotations)
- Resizing imagery for comparability
- Cropping imagery
- Adding grid overlays for spatial comparability
- White balancing imagery for color correction
- De-duplicating the image set
- Annotating the imagery for embedded word contents and overlays, and others
- Coding
- Analysis
- Write-up
- Codebook extraction
- Presentation
The image collection phase involves the collection of images based on particular requirements and from particular sources. The image processing is the equivalent of “data cleansing.” Here, the researcher(s) may write descriptions of the imagery (given that the analyses in NVivo are text-based). Imagery may be re-sized for comparability. Grid overlays may be added for spatial comparability. Images may be white-balanced for color correction. There are numerous other types of image processing that may be done as well. Note that this is done outside of NVivo. Once images are ingested, they may be annotated and described (and the related text may be coded), but the images themselves are not editable in NVivo (they are immutable or unchangeable from their original form).
Then, the images are coded—based on an a priori-defined code structure (from theory, from theories, from frameworks, from models, or other sources) or based on the images themselves in an emergent-code structure (from an unstructured bottom-up grounded theory approach). Or the coding may be based on a mix of pre-determined code structure and emergent coding.
Once the imagery is coded (and categorized), they may be analyzed. The findings may be written up. The codebook may be extracted for broader sharing (such as in the methods section of a paper or in the appendix or through other means). Then, the work is presented.
1. Image Collection
In a research project involving image analysis, the images may come from a number of sources:
• Direct image capture by the researcher or research team or others
• Pooled images from organizations
• Images from a particular website or related websites
• Images from a certain public collection
• Historical images
• Maps of various types
• Screenshots of computers screens on a network
The images may be “born digital” or digitized (from paper, microfiche, video, or other formats). Of course, it is important to have a record of where the images came from and how they were handled and processed.
The images likely already have names if they are not newly-created by the researchers. They may be re-named, or their names may be kept in the original form. New images may be named according to the researcher’s / research team’s protocols (for clarity). (Typically, it is important to use leading zeros for easy filtering and ordering; also, many use “camel case” for the names and various informational identifiers of substance and location.)
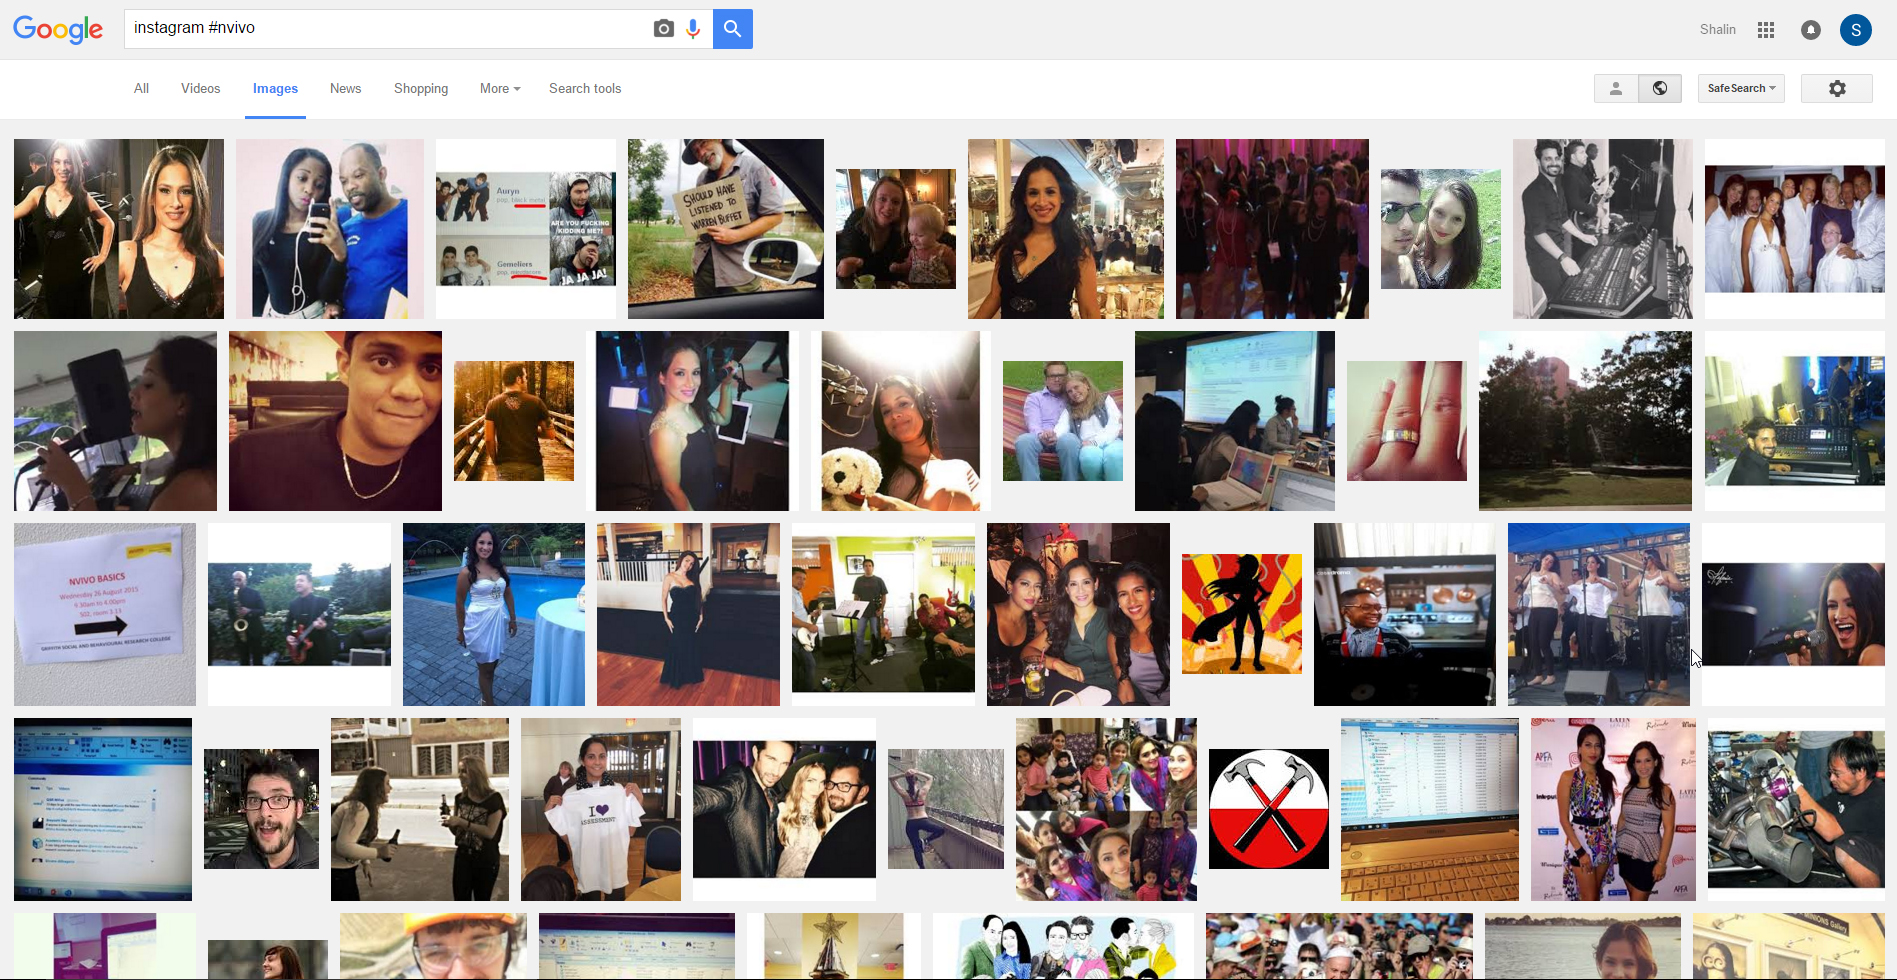
The example on this page is based on an image set from social media. Accessing images from social media may be slow-going if images are downloaded manually, but if each image is opened fully before download, the image is downloaded at full-size. If the images are scraped from the site while the images are displayed as thumbnails (as in a classic proofing sheet), then the images are often downloaded in the smaller size. In terms of image scraping, it is fairly easy to use a browser add-on to “DownThemAll” on the Firefox browser or to use “Chrono Download Manager” to download images. In addition, users may scrape all links and such.
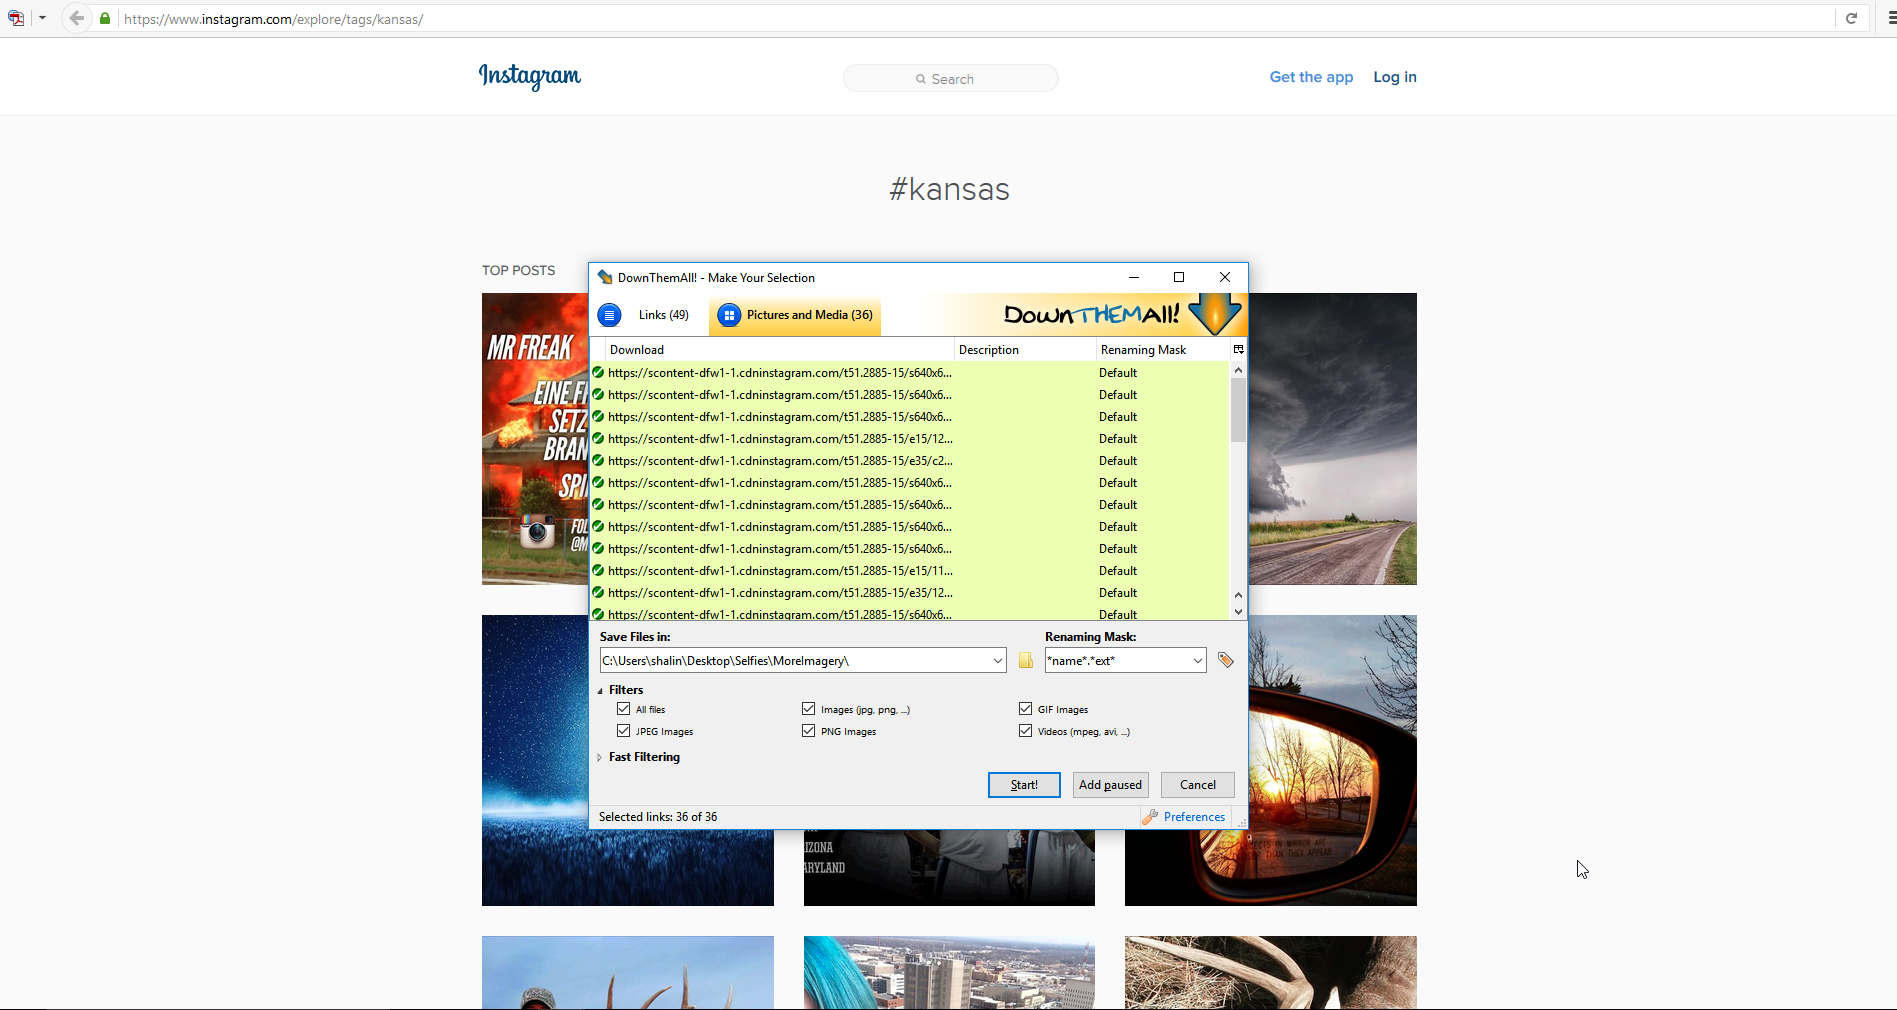
Figure 2: DownThemAll on #kansas Page on Instagram
There are also other command line ways to access imagery—using Python or even R. At thumbnail size, though, words pixelate, and there is information loss which cannot often be mitigated by zooming in. Also, in image scaping situations, the collection may often collect only a partial set, and then it’s not clear what part of the set was collected. (The scraped sample is not a random per se.) Some researchers collect imagery over certain periods of time. For those who want full image sets (an N = all), they will have to go to a third-party content provider (like Gnip) with capabilities for accessing full data sets and running queries against this “big data.”
If having high resolution images is necessary, then it may be that command line approaches are better because the size of the image capture may be part of the parameters set for the data scraper.
2. Image Processing
Various types of digital image files may be used in an NVivo project. These include the following file extensions: .bmp, .gif, .jpg, .jpeg, .png, .tif, and .tiff. The images may be of varying sizes and colors.
In some cases, depending on the needs of the project, there may be no image processing needed. In most other cases, there may be some simple processing required.
- Renaming the images
- Recoding imagery so they are of a file type
- Correction of image rotation
- Writing descriptions of the image (annotations)
- Resizing imagery for comparability
- Cropping imagery
- Adding grid overlays for spatial comparability
- White balancing imagery for color correction
- De-duplicating the image set
- Annotating the imagery for embedded word contents and overlays, and others
The decisions on how to pre-process the imagery will depend on what the researcher or researcher team will do with the images and their preferences. Will the images be used in other analytical tools? Are there sufficient numbers of images that each will need unique identifiers? Will the imagery be analyzed in other systems?
3. Coding
After the images have been ingested into an NVivo project, various types of texts may be linked to each image. For example, in the Navigation View, one would go to Sources…identify the desired image…and double click on it. Once the image is selected, it appears in the Detail View, where a researcher will click on the “Click to edit” message and begin inputting comments in the (Text) Content area. If he or she wants, he or she may use a cursor to draw a “marching ants” rectangle or square around the target area to indicate the area of interest. Once that area has been selected, he or she can go to the row in the Content area (in Detail View) to add the requisite information. If that text is selected for coding, when that coding is evoked (in the node) and the original source is surfed to, then the specific region of the selected image will be shown. Ingested digital imagery in NVivo may be analyzed to identify locations of interest on a two-dimensional plane (on the x-axis and y-axis). [While NVivo enables manipulable 3D visualizations of cluster charts, it can only ingest 3D-simulated images that are created based on the commonly known setups like lines merging towards a vanishing point, depth-of-field illusions, size effects, figure placement, foreground lighting, color contrast, object placement, size proportionality, vignetting, and others.]
Figure 3: A Visualization of Two Dimensions with the x-axis and y-axis
Another approach to image coding may be to use folders to contain particular imagery. Sometimes, categorization of image types can be highly revealing. Folder structures may be used to make queries of the images within particular folders.
While in List View, an image might be right-clicked and a memo may be attached to it. Memoing may be applied in a very granular way.
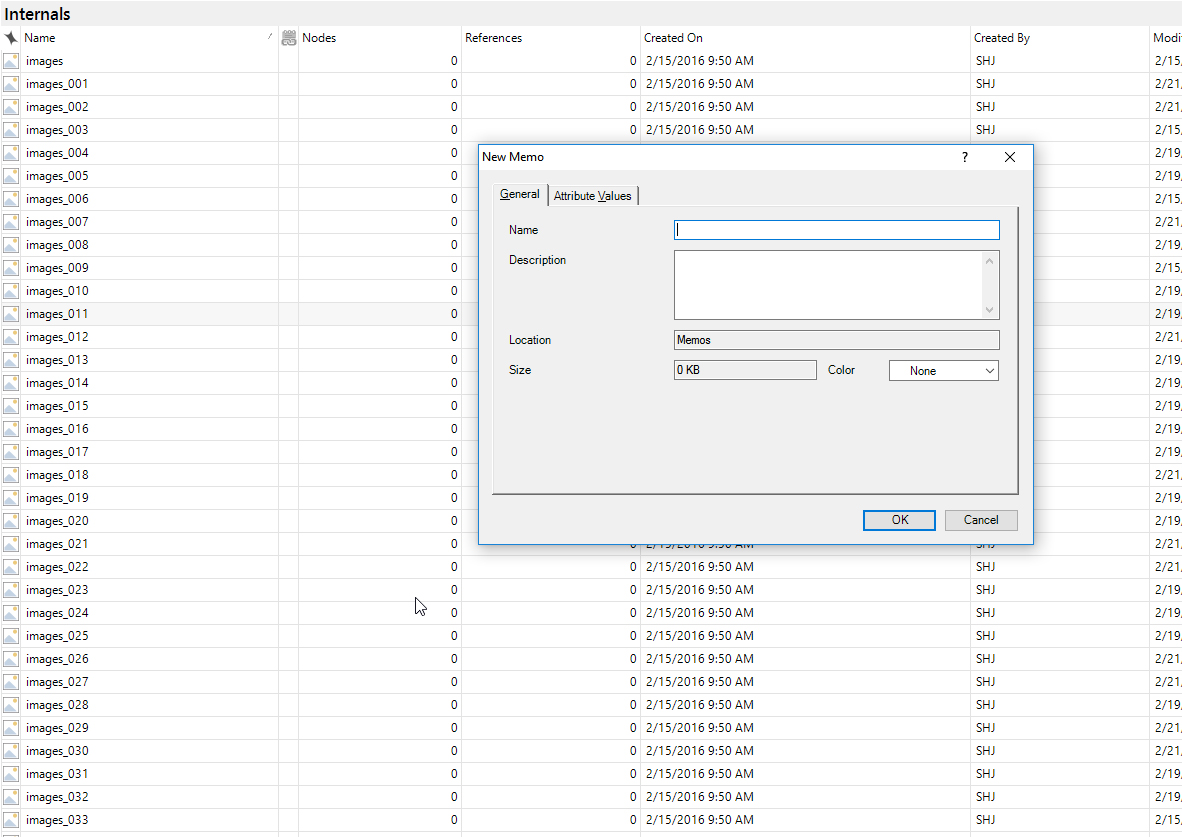
Figure 4: Adding a Memo to an Image (in List View)
In NVivo, there are multiple ways to “code” an image to particular nodes. Once an image has a textual equivalency (NVivo’s data queries and autocoding are all run over text, not audio, not imagery, not video—so each of the multimedia files have to have a textual equivalency of the image’s informational and aesthetic value). Codes are represented in NVivo as nodes.
For image-based projects, these nodes can be organized in a number of ways:
- As various categories,
- As various themes,
- As various styles,
- And others
The nodes may be created in a consistent and aligned way. Or they may be created in an overlapping way, so that multiple research questions may be pursued simultaneously. The important point to remember is that a codebook has to have clear naming protocols for the codes *and* definitions of what belongs in each category of code. When a codebook is extracted, at its most basic level, it has to have codes names listed in alphabetical order and their definitions. (If there are overlapping codebooks,
In the Detail View, it is possible to zoom in (ctrl and +) and to zoom out (ctrl and -) of an image. Depending on its resolution, much more may be seen with such actions; however, if detail is critical, it is always better to go with the highest resolution image and to use high end tools like Adobe Photoshop for image sharpening, color adjustments, image filtering, color inversions, and other methods to attain informational clarity. After such analysis outside of the NVivo project, the findings may be then placed into the .nvp project along with a description about how the researcher arrived at the particular image and insights.
Figure 5: Image Coding in NVivo
Because imagery is polysemic and complex, it seems beneficial to iterate through image sets multiple times for coding. Also, it helps to iterate through for accuracy's sake, particularly if counts are being done. This coding may be a little painstaking, and such coding also requires a fresh mind and focus.
[For social media imagery that contains text in a number of languages, Google Translate is one web-facing application that may be used to provide some translation help. That said, the output text will likely read awkwardly and in potentially confusing order. The writing on #memes and image-text visuals is also not necessarily grammatical, often by design--since there is a fair amount of slang. Mix up the confused grammar and slang...along with assumed contexts and understandings...and some of the imagery can be downright difficult to interpret with any level of confidence. ]
4. Analysis
Once the images are fully coded, the researcher may use his / her insights from the coding. He or she may use the data query tools in NVivo. He or she may also use the various autocoding features to extract further insights.
5. Write-up
He or she writes up the findings.
6. Codebook extraction
He or she extracts the codebook(s). The act of actually looking at the created codebooks can be insightful especially if an emergent form of coding was used in part or in full.
7. Presentation
The research is presented as a presentation or publication. This is considered the traditional end-point of the image analysis cycle. If researchers create the tradition of sharing image sets, it is possible that other researchers may try to reproduce the work or to spin off other research endeavors from the same image set.
Handling Larger Image Datasets
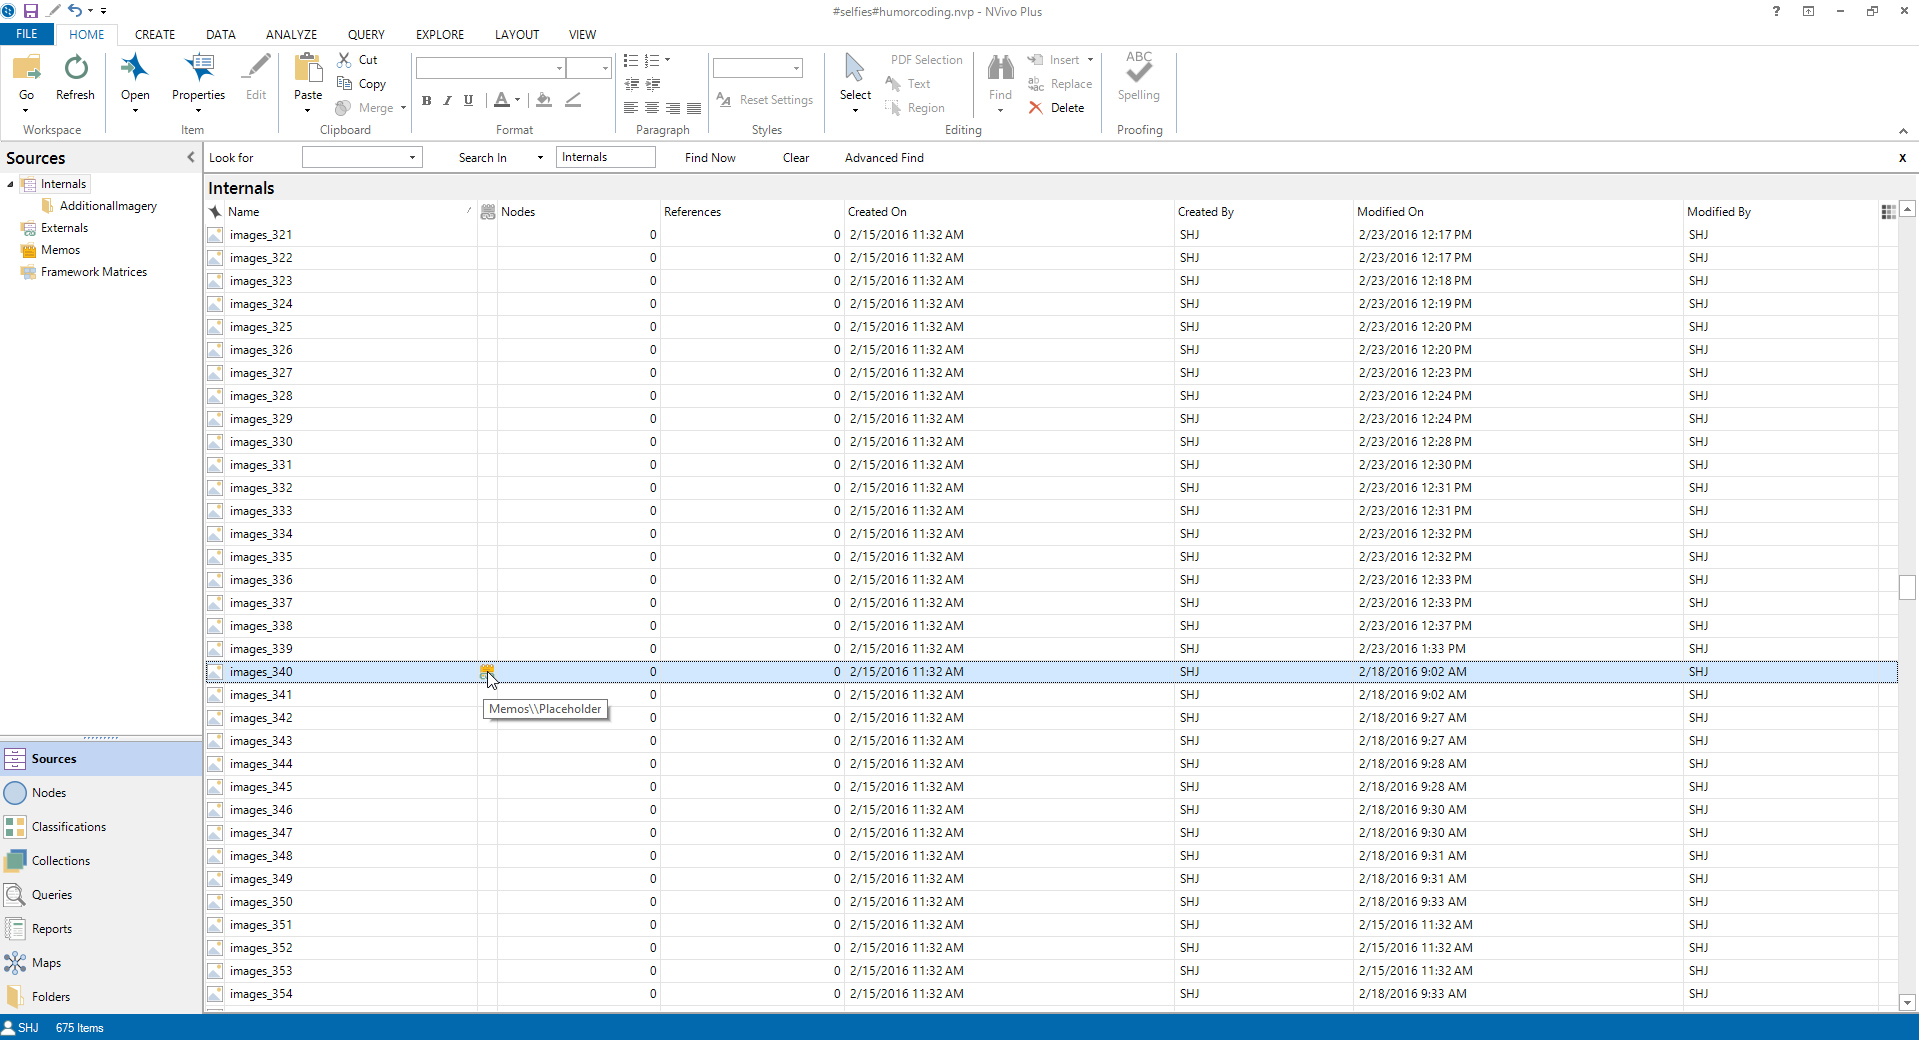
Coding hundreds or thousands of images can feel a little unwieldy even with the support of a solid technology tool. It may help to have a Word or Excel file for note-taking on the side. Also, it may help to use the memoing feature as a placeholder to mark where the coder left off last...or an image number count about where to start on return to an image-based project. To remove a memo, just right-click on the memo, go to "Memo Link" and "Delete Memo Link." (Do not accidentally delete your online source content.)
Figure 6: Using Memos as Placeholders
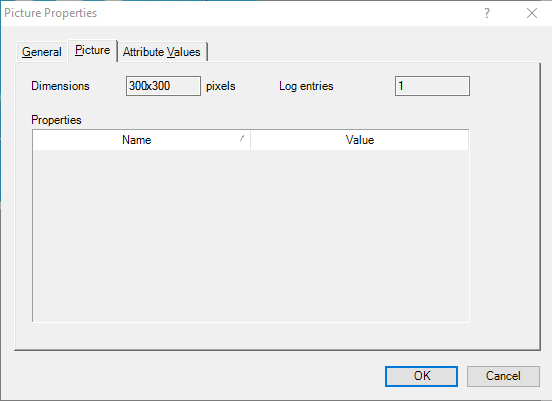
Also, when an image is in Detail View, is it possible to right click on it and look at the Picture Properties window. In this window, there are three tabs: General, Picture, and Attribute Values. Below, the "Picture" tab includes information about the image dimensions (in pixels) and the number of entries related to that picture. The General tab provides information such as the image name, text description (if any), location (folder), size, coded color (if any), date of creation, and initials of the creator. The "Attribute Values" tab contains any applied classifications.
Figure 7: "Picture Properties" Window
Conclusion
Imagery may be part of most multimedia-rich projects, and in many cases, they may be the main source content type in imagery. Coding imagery in NVivo may help shed insights that would not be possible otherwise and at scale that would not be as efficient by non-automated manual means.
Since this page was first published back around 2015, there have been advancements in coding social imagery, both manually and through computer vision.
| Previous page on path | "Using NVivo" Cover, page 16 of 58 | Next page on path |
Discussion of "Coding (Social) Imagery in NVivo"
Add your voice to this discussion.
Checking your signed in status ...