The Art in Context
1 media/Dali - WikiArt (Fair Use).jpg 2020-04-23T07:27:49-07:00 Calvin Olsen b5c5f3583225f37f1f8a2a51ca3fc4b14f902087 37344 34 plain 2020-05-01T17:20:28-07:00 Calvin Olsen b5c5f3583225f37f1f8a2a51ca3fc4b14f902087Page
| resource | rdf:resource | https://scalar.usc.edu/works/moma-19401949/the-art |
| type | rdf:type | http://scalar.usc.edu/2012/01/scalar-ns#Composite |
| is live | scalar:isLive | 1 |
| background | scalar:background | https://upload.wikimedia.org/wikipedia/commons/thumb/e/ea/Van_Gogh_-_Starry_Night_-_Google_Art_Project.jpg/1280px-Van_Gogh_-_Starry_Night_-_Google_Art_Project.jpg |
| banner | scalar:banner | media/Dali - WikiArt (Fair Use).jpg |
| was attributed to | prov:wasAttributedTo | https://scalar.usc.edu/works/moma-19401949/users/19204 |
| created | dcterms:created | 2020-04-23T07:27:49-07:00 |
Version 34
| resource | rdf:resource | https://scalar.usc.edu/works/moma-19401949/the-art.34 |
| versionnumber | ov:versionnumber | 34 |
| title | dcterms:title | The Art in Context |
| content | sioc:content | Breakdown by Department.
|
| default view | scalar:defaultView | plain |
| was attributed to | prov:wasAttributedTo | https://scalar.usc.edu/works/moma-19401949/users/19204 |
| created | dcterms:created | 2020-05-01T17:20:28-07:00 |
| type | rdf:type | http://scalar.usc.edu/2012/01/scalar-ns#Version |
Version 33
| resource | rdf:resource | https://scalar.usc.edu/works/moma-19401949/the-art.33 |
| versionnumber | ov:versionnumber | 33 |
| title | dcterms:title | The Art in Context |
| content | sioc:content | Breakdown by Department. Timeline |
| default view | scalar:defaultView | plain |
| was attributed to | prov:wasAttributedTo | https://scalar.usc.edu/works/moma-19401949/users/19204 |
| created | dcterms:created | 2020-05-01T17:19:53-07:00 |
| type | rdf:type | http://scalar.usc.edu/2012/01/scalar-ns#Version |
Version 32
| resource | rdf:resource | https://scalar.usc.edu/works/moma-19401949/the-art.32 |
| versionnumber | ov:versionnumber | 32 |
| title | dcterms:title | The Art in Context |
| content | sioc:content | Breakdown by Department. Timeline |
| default view | scalar:defaultView | plain |
| was attributed to | prov:wasAttributedTo | https://scalar.usc.edu/works/moma-19401949/users/19204 |
| created | dcterms:created | 2020-05-01T17:15:56-07:00 |
| type | rdf:type | http://scalar.usc.edu/2012/01/scalar-ns#Version |
Version 31
| resource | rdf:resource | https://scalar.usc.edu/works/moma-19401949/the-art.31 |
| versionnumber | ov:versionnumber | 31 |
| title | dcterms:title | The Art in Context |
| content | sioc:content | Breakdown by Department. Timeline |
| default view | scalar:defaultView | plain |
| was attributed to | prov:wasAttributedTo | https://scalar.usc.edu/works/moma-19401949/users/19204 |
| created | dcterms:created | 2020-05-01T13:39:05-07:00 |
| type | rdf:type | http://scalar.usc.edu/2012/01/scalar-ns#Version |
Version 30
| resource | rdf:resource | https://scalar.usc.edu/works/moma-19401949/the-art.30 |
| versionnumber | ov:versionnumber | 30 |
| title | dcterms:title | The Art in Context |
| content | sioc:content | Breakdown by Department. Timeline |
| default view | scalar:defaultView | plain |
| was attributed to | prov:wasAttributedTo | https://scalar.usc.edu/works/moma-19401949/users/19204 |
| created | dcterms:created | 2020-05-01T13:38:33-07:00 |
| type | rdf:type | http://scalar.usc.edu/2012/01/scalar-ns#Version |
Version 29
| resource | rdf:resource | https://scalar.usc.edu/works/moma-19401949/the-art.29 |
| versionnumber | ov:versionnumber | 29 |
| title | dcterms:title | The Art in Context |
| content | sioc:content | Breakdown by Department. Timeline |
| default view | scalar:defaultView | plain |
| was attributed to | prov:wasAttributedTo | https://scalar.usc.edu/works/moma-19401949/users/19204 |
| created | dcterms:created | 2020-05-01T12:48:51-07:00 |
| type | rdf:type | http://scalar.usc.edu/2012/01/scalar-ns#Version |
Version 28
| resource | rdf:resource | https://scalar.usc.edu/works/moma-19401949/the-art.28 |
| versionnumber | ov:versionnumber | 28 |
| title | dcterms:title | The Art |
| content | sioc:content | Breakdown by Department. Timeline |
| default view | scalar:defaultView | plain |
| was attributed to | prov:wasAttributedTo | https://scalar.usc.edu/works/moma-19401949/users/19204 |
| created | dcterms:created | 2020-05-01T11:47:51-07:00 |
| type | rdf:type | http://scalar.usc.edu/2012/01/scalar-ns#Version |
Version 27
| resource | rdf:resource | https://scalar.usc.edu/works/moma-19401949/the-art.27 |
| versionnumber | ov:versionnumber | 27 |
| title | dcterms:title | The Art |
| content | sioc:content | Breakdown by Department. Timeline |
| default view | scalar:defaultView | plain |
| was attributed to | prov:wasAttributedTo | https://scalar.usc.edu/works/moma-19401949/users/19204 |
| created | dcterms:created | 2020-05-01T11:44:23-07:00 |
| type | rdf:type | http://scalar.usc.edu/2012/01/scalar-ns#Version |
Version 26
| resource | rdf:resource | https://scalar.usc.edu/works/moma-19401949/the-art.26 |
| versionnumber | ov:versionnumber | 26 |
| title | dcterms:title | The Art |
| content | sioc:content | Breakdown by Department. Timeline |
| default view | scalar:defaultView | plain |
| was attributed to | prov:wasAttributedTo | https://scalar.usc.edu/works/moma-19401949/users/19204 |
| created | dcterms:created | 2020-05-01T11:09:37-07:00 |
| type | rdf:type | http://scalar.usc.edu/2012/01/scalar-ns#Version |
Version 25
| resource | rdf:resource | https://scalar.usc.edu/works/moma-19401949/the-art.25 |
| versionnumber | ov:versionnumber | 25 |
| title | dcterms:title | The Art |
| content | sioc:content | Breakdown by Department. Timeline |
| default view | scalar:defaultView | plain |
| was attributed to | prov:wasAttributedTo | https://scalar.usc.edu/works/moma-19401949/users/19204 |
| created | dcterms:created | 2020-05-01T09:51:22-07:00 |
| type | rdf:type | http://scalar.usc.edu/2012/01/scalar-ns#Version |
Version 24
| resource | rdf:resource | https://scalar.usc.edu/works/moma-19401949/the-art.24 |
| versionnumber | ov:versionnumber | 24 |
| title | dcterms:title | The Art |
| content | sioc:content | Breakdown by Department. Timeline |
| default view | scalar:defaultView | plain |
| was attributed to | prov:wasAttributedTo | https://scalar.usc.edu/works/moma-19401949/users/19204 |
| created | dcterms:created | 2020-05-01T09:49:58-07:00 |
| type | rdf:type | http://scalar.usc.edu/2012/01/scalar-ns#Version |
Version 23
| resource | rdf:resource | https://scalar.usc.edu/works/moma-19401949/the-art.23 |
| versionnumber | ov:versionnumber | 23 |
| title | dcterms:title | The Art |
| content | sioc:content | Breakdown by Department. Timeline |
| default view | scalar:defaultView | plain |
| was attributed to | prov:wasAttributedTo | https://scalar.usc.edu/works/moma-19401949/users/19204 |
| created | dcterms:created | 2020-05-01T09:49:38-07:00 |
| type | rdf:type | http://scalar.usc.edu/2012/01/scalar-ns#Version |
Version 22
| resource | rdf:resource | https://scalar.usc.edu/works/moma-19401949/the-art.22 |
| versionnumber | ov:versionnumber | 22 |
| title | dcterms:title | The Art in Context |
| content | sioc:content | Breakdown by Department. Timeline |
| default view | scalar:defaultView | plain |
| was attributed to | prov:wasAttributedTo | https://scalar.usc.edu/works/moma-19401949/users/19204 |
| created | dcterms:created | 2020-05-01T09:23:56-07:00 |
| type | rdf:type | http://scalar.usc.edu/2012/01/scalar-ns#Version |
Version 21
| resource | rdf:resource | https://scalar.usc.edu/works/moma-19401949/the-art.21 |
| versionnumber | ov:versionnumber | 21 |
| title | dcterms:title | The Art |
| content | sioc:content | Breakdown by Department. Timeline |
| default view | scalar:defaultView | plain |
| was attributed to | prov:wasAttributedTo | https://scalar.usc.edu/works/moma-19401949/users/19204 |
| created | dcterms:created | 2020-05-01T09:18:43-07:00 |
| type | rdf:type | http://scalar.usc.edu/2012/01/scalar-ns#Version |
Version 20
| resource | rdf:resource | https://scalar.usc.edu/works/moma-19401949/the-art.20 |
| versionnumber | ov:versionnumber | 20 |
| title | dcterms:title | The Art |
| content | sioc:content | Breakdown by Department. Timeline |
| default view | scalar:defaultView | plain |
| was attributed to | prov:wasAttributedTo | https://scalar.usc.edu/works/moma-19401949/users/19204 |
| created | dcterms:created | 2020-05-01T09:18:03-07:00 |
| type | rdf:type | http://scalar.usc.edu/2012/01/scalar-ns#Version |
Version 19
| resource | rdf:resource | https://scalar.usc.edu/works/moma-19401949/the-art.19 |
| versionnumber | ov:versionnumber | 19 |
| title | dcterms:title | The Art |
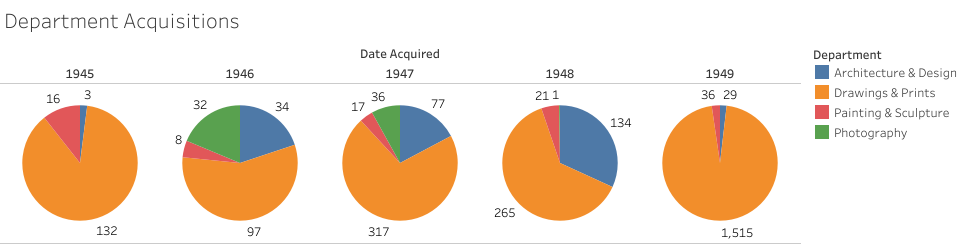
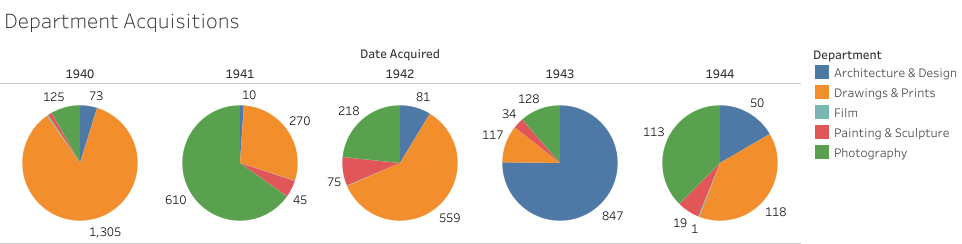
| content | sioc:content | Breakdown by DepartmentBelow you will see our fourth visualized bit of data, that of art acquired by the MoMA as it pertains to the department each year between 1940 and 1949. We have chosen to represent this information through pie charts in two different ways: in one instance, the visualization groups the first five years of the decade into one row, and the other shows each year by itself. All of the circle graphs depict the date acquired, number of acquisitions, and associated department. Over the first half of this decade, it is not clear which department was the most valued, as “Drawings and Prints,” “Photography” as well as “Architecture & Design” all had good years in terms of numbers. However, after the war had ended, “Drawings & Prints” made up the majority of acquisitions each year until the end of the decade. Notably, “Film” is not well-represented in the first half of the decade, and it is absent from the second half.. TimelineBelow you will see our fifth visualized bit of data, that of the first selected pieces by the MoMA as they pertain to a particular department each year between 1940 and 1949. Represented within the interactive timeline are works of art that signify either the highest number of acquisitions or the lowest for that year; please peruse the interface below to get started and explore. |
| default view | scalar:defaultView | plain |
| was attributed to | prov:wasAttributedTo | https://scalar.usc.edu/works/moma-19401949/users/19204 |
| created | dcterms:created | 2020-05-01T08:58:27-07:00 |
| type | rdf:type | http://scalar.usc.edu/2012/01/scalar-ns#Version |
Version 18
| resource | rdf:resource | https://scalar.usc.edu/works/moma-19401949/the-art.18 |
| versionnumber | ov:versionnumber | 18 |
| title | dcterms:title | The Art |
| content | sioc:content | Breakdown by DepartmentBelow you will see our fourth visualized bit of data, that of art acquired by the MoMA as it pertains to the department each year between 1940 and 1949. We have chosen to represent this information through pie charts in two different ways: in one instance, the visualization groups the first five years of the decade into one row, and the other shows each year by itself. All of the circle graphs depict the date acquired, number of acquisitions, and associated department. Over the first half of this decade, it is not clear which department was the most valued, as “Drawings and Prints,” “Photography” as well as “Architecture & Design” all had good years in terms of numbers. However, after the war had ended, “Drawings & Prints” made up the majority of acquisitions each year until the end of the decade. Notably, “Film” is not well-represented in the first half of the decade, and it is absent from the second half.. TimelineBelow you will see our fifth visualized bit of data, that of the first selected pieces by the MoMA as they pertain to a particular department each year between 1940 and 1949. Represented within the interactive timeline are works of art that signify either the highest number of acquisitions or the lowest for that year; please peruse the interface below to get started and explore. |
| default view | scalar:defaultView | plain |
| was attributed to | prov:wasAttributedTo | https://scalar.usc.edu/works/moma-19401949/users/19204 |
| created | dcterms:created | 2020-05-01T08:57:54-07:00 |
| type | rdf:type | http://scalar.usc.edu/2012/01/scalar-ns#Version |
Version 17
| resource | rdf:resource | https://scalar.usc.edu/works/moma-19401949/the-art.17 |
| versionnumber | ov:versionnumber | 17 |
| title | dcterms:title | The Art |
| content | sioc:content | Breakdown by DepartmentBelow you will see our fourth visualized bit of data, that of art acquired by the MoMA as it pertains to the department each year between 1940 and 1949. We have chosen to represent this information through pie charts in two different ways: in one instance, the visualization groups the first five years of the decade into one row, and the other shows each year by itself. All of the circle graphs depict the date acquired, number of acquisitions, and associated department. Over the first half of this decade, it is not clear which department was the most valued, as “Drawings and Prints,” “Photography” as well as “Architecture & Design” all had good years in terms of numbers. However, after the war had ended, “Drawings & Prints” made up the majority of acquisitions each year until the end of the decade. Notably, “Film” is not well-represented in the first half of the decade, and it is absent from the second half.. TimelineBelow you will see our fifth visualized bit of data, that of the first selected pieces by the MoMA as they pertain to a particular department each year between 1940 and 1949. Represented within the interactive timeline are works of art that signify either the highest number of acquisitions or the lowest for that year; please peruse the interface below to get started and explore.. . . |
| default view | scalar:defaultView | plain |
| was attributed to | prov:wasAttributedTo | https://scalar.usc.edu/works/moma-19401949/users/19204 |
| created | dcterms:created | 2020-05-01T08:55:17-07:00 |
| type | rdf:type | http://scalar.usc.edu/2012/01/scalar-ns#Version |
Version 16
| resource | rdf:resource | https://scalar.usc.edu/works/moma-19401949/the-art.16 |
| versionnumber | ov:versionnumber | 16 |
| title | dcterms:title | The Art |
| content | sioc:content | Breakdown by DepartmentBelow you will see our fourth visualized bit of data, that of art acquired by the MoMA as it pertains to the department each year between 1940 and 1949. We have chosen to represent this information through pie charts in two different ways: in one instance, the visualization groups the first five years of the decade into one row, and the other shows each year by itself. All of the circle graphs depict the date acquired, number of acquisitions, and associated department. Over the first half of this decade, it is not clear which department was the most valued, as “Drawings and Prints,” “Photography” as well as “Architecture & Design” all had good years in terms of numbers. However, after the war had ended, “Drawings & Prints” made up the majority of acquisitions each year until the end of the decade. Notably, “Film” is not well-represented in the first half of the decade, and it is absent from the second half.. TimelineBelow you will see our fifth visualized bit of data, that of the first selected pieces by the MoMA as they pertain to a particular department each year between 1940 and 1949. Represented within the interactive timeline are works of art that signify either the highest number of acquisitions or the lowest for that year; please peruse the interface below to get started and explore.. . . |
| default view | scalar:defaultView | plain |
| was attributed to | prov:wasAttributedTo | https://scalar.usc.edu/works/moma-19401949/users/19204 |
| created | dcterms:created | 2020-05-01T08:54:44-07:00 |
| type | rdf:type | http://scalar.usc.edu/2012/01/scalar-ns#Version |
Version 15
| resource | rdf:resource | https://scalar.usc.edu/works/moma-19401949/the-art.15 |
| versionnumber | ov:versionnumber | 15 |
| title | dcterms:title | The Art |
| content | sioc:content | [INTRO TO ART HERE] Department Below you will see our fourth visualized bit of data, that of art acquired by the MoMA as it pertains to the department each year between 1940 and 1949. We have chosen to represent this information through pie charts in two different ways: in one instance, the visualization groups the first five years of the decade into one row, and the other shows each year by itself. All of the circle graphs depict the date acquired, number of acquisitions, and associated department. Over the first half of this decade, it is not clear which department was the most valued, as “Drawings and Prints,” “Photography” as well as “Architecture & Design” all had good years in terms of numbers. However, after the war had ended, “Drawings & Prints” made up the majority of acquisitions each year until the end of the decade. Notably, “Film” is not well-represented in the first half of the decade, and it is absent from the second half. . . Timeline Below you will see our fifth visualized bit of data, that of the first selected pieces by the MoMA as they pertain to a particular department each year between 1940 and 1949. Represented within the interactive timeline are works of art that signify either the highest number of acquisitions or the lowest for that year; please peruse the interface below to get started and explore. . . . |
| default view | scalar:defaultView | plain |
| was attributed to | prov:wasAttributedTo | https://scalar.usc.edu/works/moma-19401949/users/19204 |
| created | dcterms:created | 2020-05-01T08:53:32-07:00 |
| type | rdf:type | http://scalar.usc.edu/2012/01/scalar-ns#Version |
Version 14
| resource | rdf:resource | https://scalar.usc.edu/works/moma-19401949/the-art.14 |
| versionnumber | ov:versionnumber | 14 |
| title | dcterms:title | The Art |
| content | sioc:content | [INTRO TO ART HERE] Department Below you will see our fourth visualized bit of data, that of art acquired by the MoMA as it pertains to the department each year between 1940 and 1949. We have chosen to represent this information through pie charts in two different ways: in one instance, the visualization groups the first five years of the decade into one row, and the other shows each year by itself. All of the circle graphs depict the date acquired, number of acquisitions, and associated department. Over the first half of this decade, it is not clear which department was the most valued, as “Drawings and Prints,” “Photography” as well as “Architecture & Design” all had good years in terms of numbers. However, after the war had ended, “Drawings & Prints” made up the majority of acquisitions each year until the end of the decade. Notably, “Film” is not well-represented in the first half of the decade, and it is absent from the second half. . . Timeline Below you will see our fifth visualized bit of data, that of the first selected pieces by the MoMA as they pertain to a particular department each year between 1940 and 1949. Represented within the interactive timeline are works of art that signify either the highest number of acquisitions or the lowest for that year; please peruse the interface below to get started and explore. . . . |
| default view | scalar:defaultView | plain |
| was attributed to | prov:wasAttributedTo | https://scalar.usc.edu/works/moma-19401949/users/19204 |
| created | dcterms:created | 2020-05-01T08:52:42-07:00 |
| type | rdf:type | http://scalar.usc.edu/2012/01/scalar-ns#Version |
Version 13
| resource | rdf:resource | https://scalar.usc.edu/works/moma-19401949/the-art.13 |
| versionnumber | ov:versionnumber | 13 |
| title | dcterms:title | The Art |
| content | sioc:content | [INTRO TO ART HERE] Department Below you will see our fourth visualized bit of data, that of art acquired by the MoMA as it pertains to the department each year between 1940 and 1949. We have chosen to represent this information through pie charts in two different ways: in one instance, the visualization groups the first five years of the decade into one row, and the other shows each year by itself. All of the circle graphs depict the date acquired, number of acquisitions, and associated department. Over the first half of this decade, it is not clear which department was the most valued, as “Drawings and Prints,” “Photography” as well as “Architecture & Design” all had good years in terms of numbers. However, after the war had ended, “Drawings & Prints” made up the majority of acquisitions each year until the end of the decade. Notably, “Film” is not well-represented in the first half of the decade, and it is absent from the second half. . . Timeline Below you will see our fifth visualized bit of data, that of the first selected pieces by the MoMA as they pertain to a particular department each year between 1940 and 1949. Represented within the interactive timeline are works of art that signify either the highest number of acquisitions or the lowest for that year; please peruse the interface below to get started and explore. . . . |
| default view | scalar:defaultView | structured_gallery |
| was attributed to | prov:wasAttributedTo | https://scalar.usc.edu/works/moma-19401949/users/19204 |
| created | dcterms:created | 2020-05-01T08:52:05-07:00 |
| type | rdf:type | http://scalar.usc.edu/2012/01/scalar-ns#Version |
Version 12
| resource | rdf:resource | https://scalar.usc.edu/works/moma-19401949/the-art.12 |
| versionnumber | ov:versionnumber | 12 |
| title | dcterms:title | The Art |
| content | sioc:content | [INTRO TO ART HERE] Department Below you will see our fourth visualized bit of data, that of art acquired by the MoMA as it pertains to the department each year between 1940 and 1949. We have chosen to represent this information through pie charts in two different ways: in one instance, the visualization groups the first five years of the decade into one row, and the other shows each year by itself. All of the circle graphs depict the date acquired, number of acquisitions, and associated department. Over the first half of this decade, it is not clear which department was the most valued, as “Drawings and Prints,” “Photography” as well as “Architecture & Design” all had good years in terms of numbers. However, after the war had ended, “Drawings & Prints” made up the majority of acquisitions each year until the end of the decade. Notably, “Film” is not well-represented in the first half of the decade, and it is absent from the second half. . . Timeline Below you will see our fifth visualized bit of data, that of the first selected pieces by the MoMA as they pertain to a particular department each year between 1940 and 1949. Represented within the interactive timeline are works of art that signify either the highest number of acquisitions or the lowest for that year; please peruse the interface below to get started and explore. . . . |
| default view | scalar:defaultView | gallery |
| was attributed to | prov:wasAttributedTo | https://scalar.usc.edu/works/moma-19401949/users/19204 |
| created | dcterms:created | 2020-05-01T08:51:35-07:00 |
| type | rdf:type | http://scalar.usc.edu/2012/01/scalar-ns#Version |
Version 11
| resource | rdf:resource | https://scalar.usc.edu/works/moma-19401949/the-art.11 |
| versionnumber | ov:versionnumber | 11 |
| title | dcterms:title | The Art |
| content | sioc:content | [INTRO TO ART HERE] Department Below you will see our fourth visualized bit of data, that of art acquired by the MoMA as it pertains to the department each year between 1940 and 1949. We have chosen to represent this information through pie charts in two different ways: in one instance, the visualization groups the first five years of the decade into one row, and the other shows each year by itself. All of the circle graphs depict the date acquired, number of acquisitions, and associated department. Over the first half of this decade, it is not clear which department was the most valued, as “Drawings and Prints,” “Photography” as well as “Architecture & Design” all had good years in terms of numbers. However, after the war had ended, “Drawings & Prints” made up the majority of acquisitions each year until the end of the decade. Notably, “Film” is not well-represented in the first half of the decade, and it is absent from the second half. . Timeline Below you will see our fifth visualized bit of data, that of the first selected pieces by the MoMA as they pertain to a particular department each year between 1940 and 1949. Represented within the interactive timeline are works of art that signify either the highest number of acquisitions or the lowest for that year; please peruse the interface below to get started and explore. . . . |
| default view | scalar:defaultView | gallery |
| was attributed to | prov:wasAttributedTo | https://scalar.usc.edu/works/moma-19401949/users/19204 |
| created | dcterms:created | 2020-05-01T08:51:03-07:00 |
| type | rdf:type | http://scalar.usc.edu/2012/01/scalar-ns#Version |
Version 10
| resource | rdf:resource | https://scalar.usc.edu/works/moma-19401949/the-art.10 |
| versionnumber | ov:versionnumber | 10 |
| title | dcterms:title | The Art |
| content | sioc:content | [INTRO TO ART HERE] Department Below you will see our fourth visualized bit of data, that of art acquired by the MoMA as it pertains to the department each year between 1940 and 1949. We have chosen to represent this information through pie charts in two different ways: in one instance, the visualization groups the first five years of the decade into one row, and the other shows each year by itself. All of the circle graphs depict the date acquired, number of acquisitions, and associated department. Over the first half of this decade, it is not clear which department was the most valued, as “Drawings and Prints,” “Photography” as well as “Architecture & Design” all had good years in terms of numbers. However, after the war had ended, “Drawings & Prints” made up the majority of acquisitions each year until the end of the decade. Notably, “Film” is not well-represented in the first half of the decade, and it is absent from the second half. . Timeline Below you will see our fifth visualized bit of data, that of the first selected pieces by the MoMA as they pertain to a particular department each year between 1940 and 1949. Represented within the interactive timeline are works of art that signify either the highest number of acquisitions or the lowest for that year; please peruse the interface below to get started and explore. . . . |
| default view | scalar:defaultView | gallery |
| was attributed to | prov:wasAttributedTo | https://scalar.usc.edu/works/moma-19401949/users/19204 |
| created | dcterms:created | 2020-05-01T08:50:12-07:00 |
| type | rdf:type | http://scalar.usc.edu/2012/01/scalar-ns#Version |
Version 9
| resource | rdf:resource | https://scalar.usc.edu/works/moma-19401949/the-art.9 |
| versionnumber | ov:versionnumber | 9 |
| title | dcterms:title | The Art |
| content | sioc:content | [INTRO TO ART HERE] Department Below you will see our fourth visualized bit of data, that of art acquired by the MoMA as it pertains to the department each year between 1940 and 1949. We have chosen to represent this information through pie charts in two different ways: in one instance, the visualization groups the first five years of the decade into one row, and the other shows each year by itself. All of the circle graphs depict the date acquired, number of acquisitions, and associated department. Over the first half of this decade, it is not clear which department was the most valued, as “Drawings and Prints,” “Photography” as well as “Architecture & Design” all had good years in terms of numbers. However, after the war had ended, “Drawings & Prints” made up the majority of acquisitions each year until the end of the decade. Notably, “Film” is not well-represented in the first half of the decade, and it is absent from the second half. . Timeline Below you will see our fifth visualized bit of data, that of the first selected pieces by the MoMA as they pertain to a particular department each year between 1940 and 1949. Represented within the interactive timeline are works of art that signify either the highest number of acquisitions or the lowest for that year; please peruse the interface below to get started and explore. . . . |
| default view | scalar:defaultView | gallery |
| was attributed to | prov:wasAttributedTo | https://scalar.usc.edu/works/moma-19401949/users/19204 |
| created | dcterms:created | 2020-05-01T08:49:29-07:00 |
| type | rdf:type | http://scalar.usc.edu/2012/01/scalar-ns#Version |
Version 8
| resource | rdf:resource | https://scalar.usc.edu/works/moma-19401949/the-art.8 |
| versionnumber | ov:versionnumber | 8 |
| title | dcterms:title | The Art |
| content | sioc:content | [INTRO TO ART HERE] Department Below you will see our fourth visualized bit of data, that of art acquired by the MoMA as it pertains to the department each year between 1940 and 1949. We have chosen to represent this information through pie charts in two different ways: in one instance, the visualization groups the first five years of the decade into one row, and the other shows each year by itself. All of the circle graphs depict the date acquired, number of acquisitions, and associated department. Over the first half of this decade, it is not clear which department was the most valued, as “Drawings and Prints,” “Photography” as well as “Architecture & Design” all had good years in terms of numbers. However, after the war had ended, “Drawings & Prints” made up the majority of acquisitions each year until the end of the decade. Notably, “Film” is not well-represented in the first half of the decade, and it is absent from the second half. . . . . Timeline Below you will see our fifth visualized bit of data, that of the first selected pieces by the MoMA as they pertain to a particular department each year between 1940 and 1949. Represented within the interactive timeline are works of art that signify either the highest number of acquisitions or the lowest for that year; please peruse the interface below to get started and explore. . . . |
| default view | scalar:defaultView | gallery |
| was attributed to | prov:wasAttributedTo | https://scalar.usc.edu/works/moma-19401949/users/19204 |
| created | dcterms:created | 2020-04-30T14:41:28-07:00 |
| type | rdf:type | http://scalar.usc.edu/2012/01/scalar-ns#Version |
Version 7
| resource | rdf:resource | https://scalar.usc.edu/works/moma-19401949/the-art.7 |
| versionnumber | ov:versionnumber | 7 |
| title | dcterms:title | The Art |
| default view | scalar:defaultView | gallery |
| was attributed to | prov:wasAttributedTo | https://scalar.usc.edu/works/moma-19401949/users/19204 |
| created | dcterms:created | 2020-04-29T08:21:03-07:00 |
| type | rdf:type | http://scalar.usc.edu/2012/01/scalar-ns#Version |
Version 6
| resource | rdf:resource | https://scalar.usc.edu/works/moma-19401949/the-art.6 |
| versionnumber | ov:versionnumber | 6 |
| title | dcterms:title | The Art |
| default view | scalar:defaultView | gallery |
| was attributed to | prov:wasAttributedTo | https://scalar.usc.edu/works/moma-19401949/users/19204 |
| created | dcterms:created | 2020-04-23T12:33:15-07:00 |
| type | rdf:type | http://scalar.usc.edu/2012/01/scalar-ns#Version |
Version 5
| resource | rdf:resource | https://scalar.usc.edu/works/moma-19401949/the-art.5 |
| versionnumber | ov:versionnumber | 5 |
| title | dcterms:title | The Art |
| default view | scalar:defaultView | structured_gallery |
| was attributed to | prov:wasAttributedTo | https://scalar.usc.edu/works/moma-19401949/users/19204 |
| created | dcterms:created | 2020-04-23T12:31:41-07:00 |
| type | rdf:type | http://scalar.usc.edu/2012/01/scalar-ns#Version |
Version 4
| resource | rdf:resource | https://scalar.usc.edu/works/moma-19401949/the-art.4 |
| versionnumber | ov:versionnumber | 4 |
| title | dcterms:title | The Art |
| default view | scalar:defaultView | structured_gallery |
| was attributed to | prov:wasAttributedTo | https://scalar.usc.edu/works/moma-19401949/users/19204 |
| created | dcterms:created | 2020-04-23T12:31:36-07:00 |
| type | rdf:type | http://scalar.usc.edu/2012/01/scalar-ns#Version |
Version 3
| resource | rdf:resource | https://scalar.usc.edu/works/moma-19401949/the-art.3 |
| versionnumber | ov:versionnumber | 3 |
| title | dcterms:title | The Art |
| default view | scalar:defaultView | plain |
| was attributed to | prov:wasAttributedTo | https://scalar.usc.edu/works/moma-19401949/users/19204 |
| created | dcterms:created | 2020-04-23T12:28:41-07:00 |
| type | rdf:type | http://scalar.usc.edu/2012/01/scalar-ns#Version |
Version 2
| resource | rdf:resource | https://scalar.usc.edu/works/moma-19401949/the-art.2 |
| versionnumber | ov:versionnumber | 2 |
| title | dcterms:title | The Art |
| default view | scalar:defaultView | plain |
| was attributed to | prov:wasAttributedTo | https://scalar.usc.edu/works/moma-19401949/users/19204 |
| created | dcterms:created | 2020-04-23T07:42:39-07:00 |
| type | rdf:type | http://scalar.usc.edu/2012/01/scalar-ns#Version |
Version 1
| resource | rdf:resource | https://scalar.usc.edu/works/moma-19401949/the-art.1 |
| versionnumber | ov:versionnumber | 1 |
| title | dcterms:title | The Art |
| default view | scalar:defaultView | plain |
| was attributed to | prov:wasAttributedTo | https://scalar.usc.edu/works/moma-19401949/users/19204 |
| created | dcterms:created | 2020-04-23T07:27:50-07:00 |
| type | rdf:type | http://scalar.usc.edu/2012/01/scalar-ns#Version |