Tag Visualization
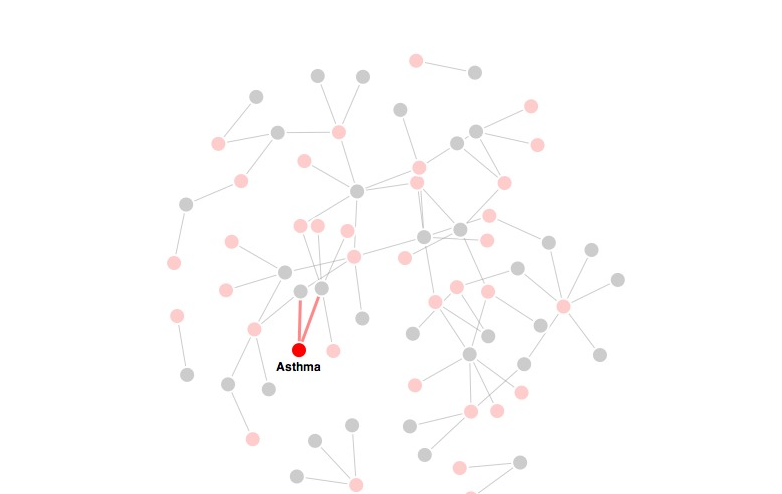
The tag visualization displays the book's tags in a force-directed graph, along with the content they tag. For performance reasons, only selected tags and their relationships are shown; to show all tags, all items must be deselected. Individual items can be selected and deselected by clicking. Double-clicking a title opens the associated content (page or media file).
| Previous page on path | Visualizations, page 5 of 5 | Path end, continue |
Discussion of "Tag Visualization"
Add your voice to this discussion.
Checking your signed in status ...