Running a Q-Methodology on an Online Survey Platform
By Shalin Hai-Jew, Kansas State University
Figure 1. Latin Letter Q (from Wikimedia Commons)
From the q-method research participant side, an analog q-sort goes something like this… The participant is invited based on his or her particular knowledge and opinions about an in-world issue or phenomenon. One point of the research is to collect his or her preferences and opinions. The participant is handed a stack of cards with text information on them. (Some q-method studies have image prompts or multimodal data prompts.) The respondent is asked to rank the stack into three basic categories: (1) agree strongly, (2) neutral, and (3) disagree strongly. (Some q-methods studies involve only two categories: agree strongly or disagree strongly. Some have categories of various intensity gradations of agreement / disagreement.) The categories are represented in a q-sort grid (or card-sort grid/template/scorecard). Each card can only be placed once, and once a spot is taken on the grid, that spot cannot be used again; however, the cards can be moved until the respondent indicates that he or she is done. After the cards have all been placed satisfactorily (and every cell in the q-sort grid is filled), the respondent is asked to review the card placements and provide some insights on their ranking selections in a post-sort interview. The research is comprised of two parts: the q-sort, and the post-sort interview.
A digital one may involve the collection of demographic information, the conducting of a card-sort online, and a post-q-sort debriefing via a text response online. There may be directions given via text, audio, and video.
A core assumption of q-method research is that everyone is entitled to his/her own opinions. For the individual, those subjective perspectives may (partially) inform their decision making and actions. In groups, people’s collective opinions may be analyzed as patterns of agreements and disagreements of various points of view, and these respective preference patterns may be captured to saturation (all reasonable possibilities) for a better understanding of the combinations of granular points that comprise whole coherent (composited) viewpoints held by individuals and groups.
Of course, as in virtually every research context, much lead-up design and development work is required to enable the actual research. And after the data is collected, there is often complex follow-on data analysis. This short article will provide a light overview of q-methodology through a summary of its main terms and processes.
Q-methodology has been around since 1935, when William Stephenson—a physicist and psychologist (1902 – 1989)—suggested the power of inverting correlations between variables to find factors by studying the “correlations between subjects across a sample of variables” (Q methodology, Apr. 5, 2018). Instead of “r” correlations, “q” ones may result in different insights (leading to q-sort profiles). In the intervening years up through the present, according to the academic literature, q-inquiries have been used to inform policy-making, product design, marketing and advertising, service provision, and other practical applications—in the environmental sciences, political science, sociology, business, and other fields.
The basic sequence is depicted in Figure 1. The setup involves developing a q-methodology research design, including research questions. Some general askable questions seem to be the following:
- What are the general stances that diverse and knowledgeable individuals take on a particular topic?
- What do these subjective stances suggest about their preferences? Their future behaviors?
In the setup phase, there is also the identification of “data rich” individuals who can speak to a particular issue based on their knowledge, their subjectivities, and potentially their formal roles in relation to the topic. These individuals are members of the “p-set” (participants).
Based on the research question, research (formal and informal) is done to understand the types of “discourses” around the issue, and a full set of these are collected in a “concourse” (q-universe). From this full set of commenting, a set of “cards” is collected for the q-sort activity. These cards should comprehensively cover a range of potential relevant opinions related to the topic.
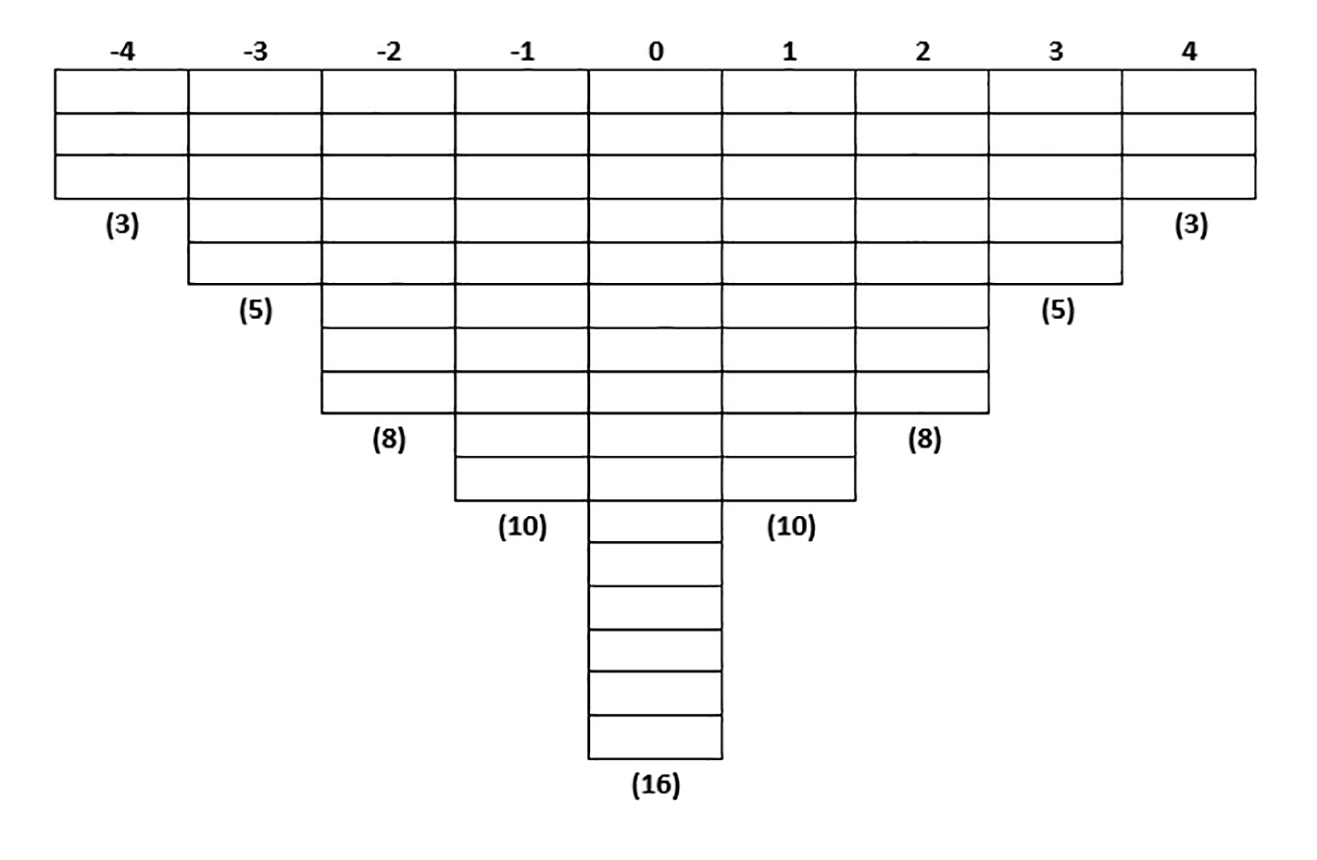
Figure 2. A Light Summary of the Q-Methodology Research Approach
From these, a q-sort grid (or card-sort grid/template/scorecard) is developed in the shape of a bell. (Figure 2) There is a sense of a forced standard distribution in this shape. Some grids show an upside-down bell (as this example), and others show a right-side-up one.
Figure 3. A Sample Card-Sort Grid for 68 Cards
One rule of thumb is that the number of cards in the q-set (to be sorted) should be somewhat higher than the number of p-set respondents. Different research studies point to between 40 – 60 p-set members in their studies. The “p-set” is identified through “strategic” instead of “random” sampling, and the focus is on data rich individuals who can speak to subjectivities related to a particular topic. In some studies, these are members of the general public; in others, they may be experts, or they may be a combination of various individuals based on different role types. The idea is to purposefully infuse diversity into the participant group.
Once the two steps of the research are conducted—the q-sort and the debriefing with the respondent—the data may be analyzed with frequency counts, correlation-based factor analyses, q-analyses of q-sort profiles among people, cluster analyses to identify groups of individuals with similar subjectivity patterns, and others.
The following is a basic introductory video about q-methodology.
Online Q-Methods
Several years ago, an individual worked to recreate the “graphic elicitation” sense of a q-sort using Qualtrics. This is a light view dealing with the graphic elicitation aspects and not so much the requisite statistical analyses.
The various affordances of this online survey research suite enables some strengths and some weaknesses here. It is clear that the data has to be cleaned and restructured depending on the various data queries. For a separate project, a sample q-method study was created around the topic of what respondents think should be basic features of graduate research studies related to educational technologies. The sample q-method survey may be accessed here.
The early demographic queries are from the open-shared Qualtrics library of various survey blocks, and those may be bypassed by clicking the forward button.
Conclusion
This work introduces q-method as a research method with some fairly wide usage in public and private sectors as well as academia.
References
“Q methodology.” (2018, Apr. 5). Wikipedia. Retrieved Jan. 29, 2019, from https://en.wikipedia.org/wiki/Q_methodology.
About the Author
Shalin Hai-Jew works as an instructional designer at Kansas State University. Her email is shalin@k-state.edu.
| Previous page on path | Cover, page 16 of 23 | Next page on path |
Discussion of "Running a Q-Methodology on an Online Survey Platform"
Add your voice to this discussion.
Checking your signed in status ...