Gleaning Insights from Canvas LMS Reports
By Shalin Hai-Jew, Kansas State University
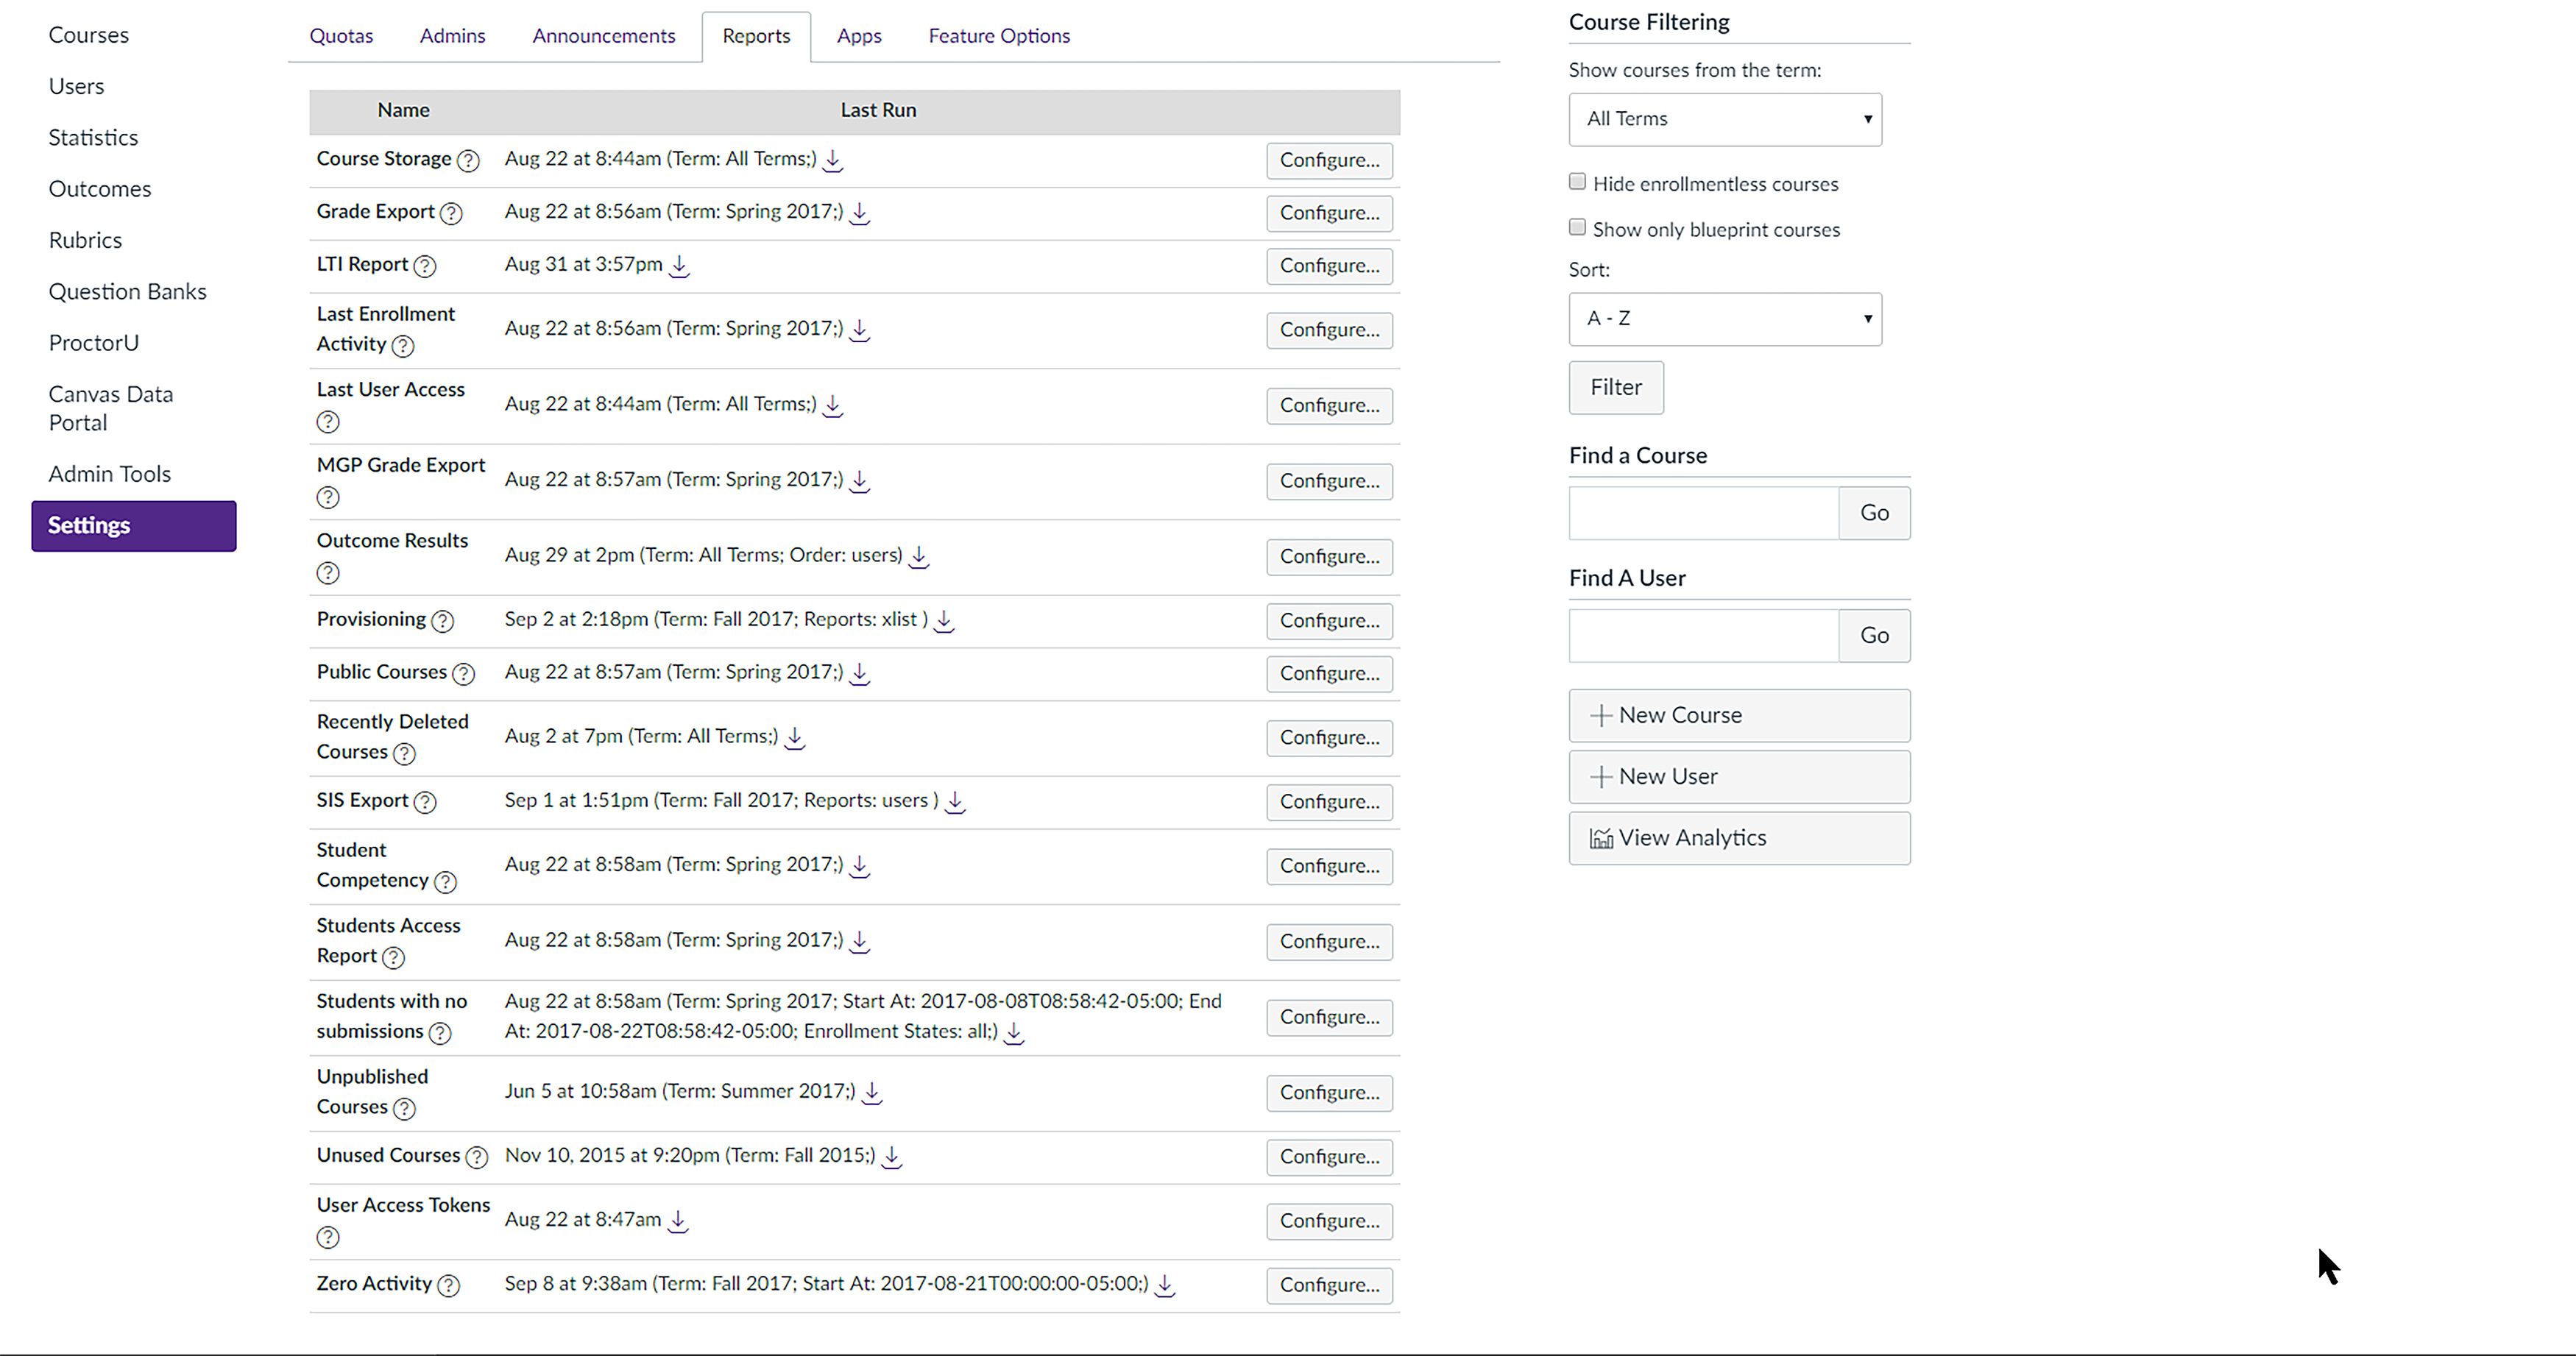
Figure 1: The Reports Tab in the Canvas LMS
As a follow-on work to the exploration of data from the K-State Online LMS Data Portal (powered by Instructure’s Canvas), this article describes some of the possible public insights from the admin-accessible reports. These reports are pre-collected data about some limited aspects of the LMS. This work provides some insights into what is available. Some data visualizations are shared (albeit without leaking person-related information.) (To get to the Reports, log in as Admin, go to Settings, and click on the Reports tab.)
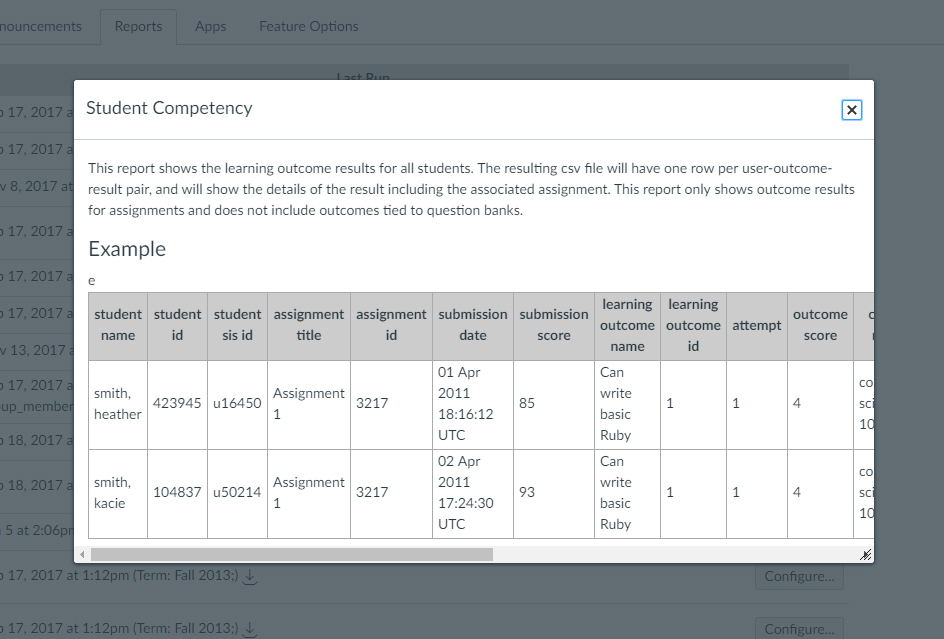
To understand what the respective datasets contain, click the circle with a question mark on it next to the name of the dataset at the left. A pop-up window will open explaining the data types (Figure 2). The data table underneath the explanation is faux data provided by Instructure for their documentation.
Figure 2: The Pop-up Window Explaining "Student Competency" Data
The LMS’s Reports feature enables the user to change the term to either All Terms, Default Term, or a particular Named Term (Figure 3). Some of the reports enable beginning with a customized time period...and / or the defining of a customized start and end period. These are the main options available in terms of report configurations.
Depending on the report type, there may be selections of included variables. Submittal of new report configurations may be done easily in the dropdown, and the reports are returned very quickly. The idea is to submit the request, click away from the site, and then return, and in many cases, the updated reports are ready for download. (No email notifications were sent to indicate that the downloads were ready per se. In one of the earlier trial runs, I waited on the emails and did not check back for hours...and so assumed that the actual report-making took that long. Not so much. The K-State instance of the Canvas LMS is a hosted solution, so the work was done on remote servers.) The reports download with some informative elements of the data table name and the download date...but does not indicate the particular target terms in the name, so for proper and easier handling, it would be good to include that information in the naming protocols.
The quick analyses done here were achieved with extant reports as the settings were pre-configured.
Some of the reports do not just download as a .csv file but download as a zip folder full of related .csv data tables.
Figure 3: Configuration of Report Options
About Grade Exports
During Spring 2017, 123,985 grades were exported. The average current score was 83.61 (with 0s averaged in), with a min-max range of -150 to 5725.5. The average final score was 75.49 (with 0s averaged in), and a min-max range of -22.96 to 1544.05. In terms of the courses from which grades were exported, the ratio of “active” ones to “concluded” ones were 4:1 (Figure 4). This might suggest that grades are exported while there is still time to make changes and the issues are live.
Figure 4: Course States in Grade Export Data Set (Spring 2017)
About Course Storage Space Usage
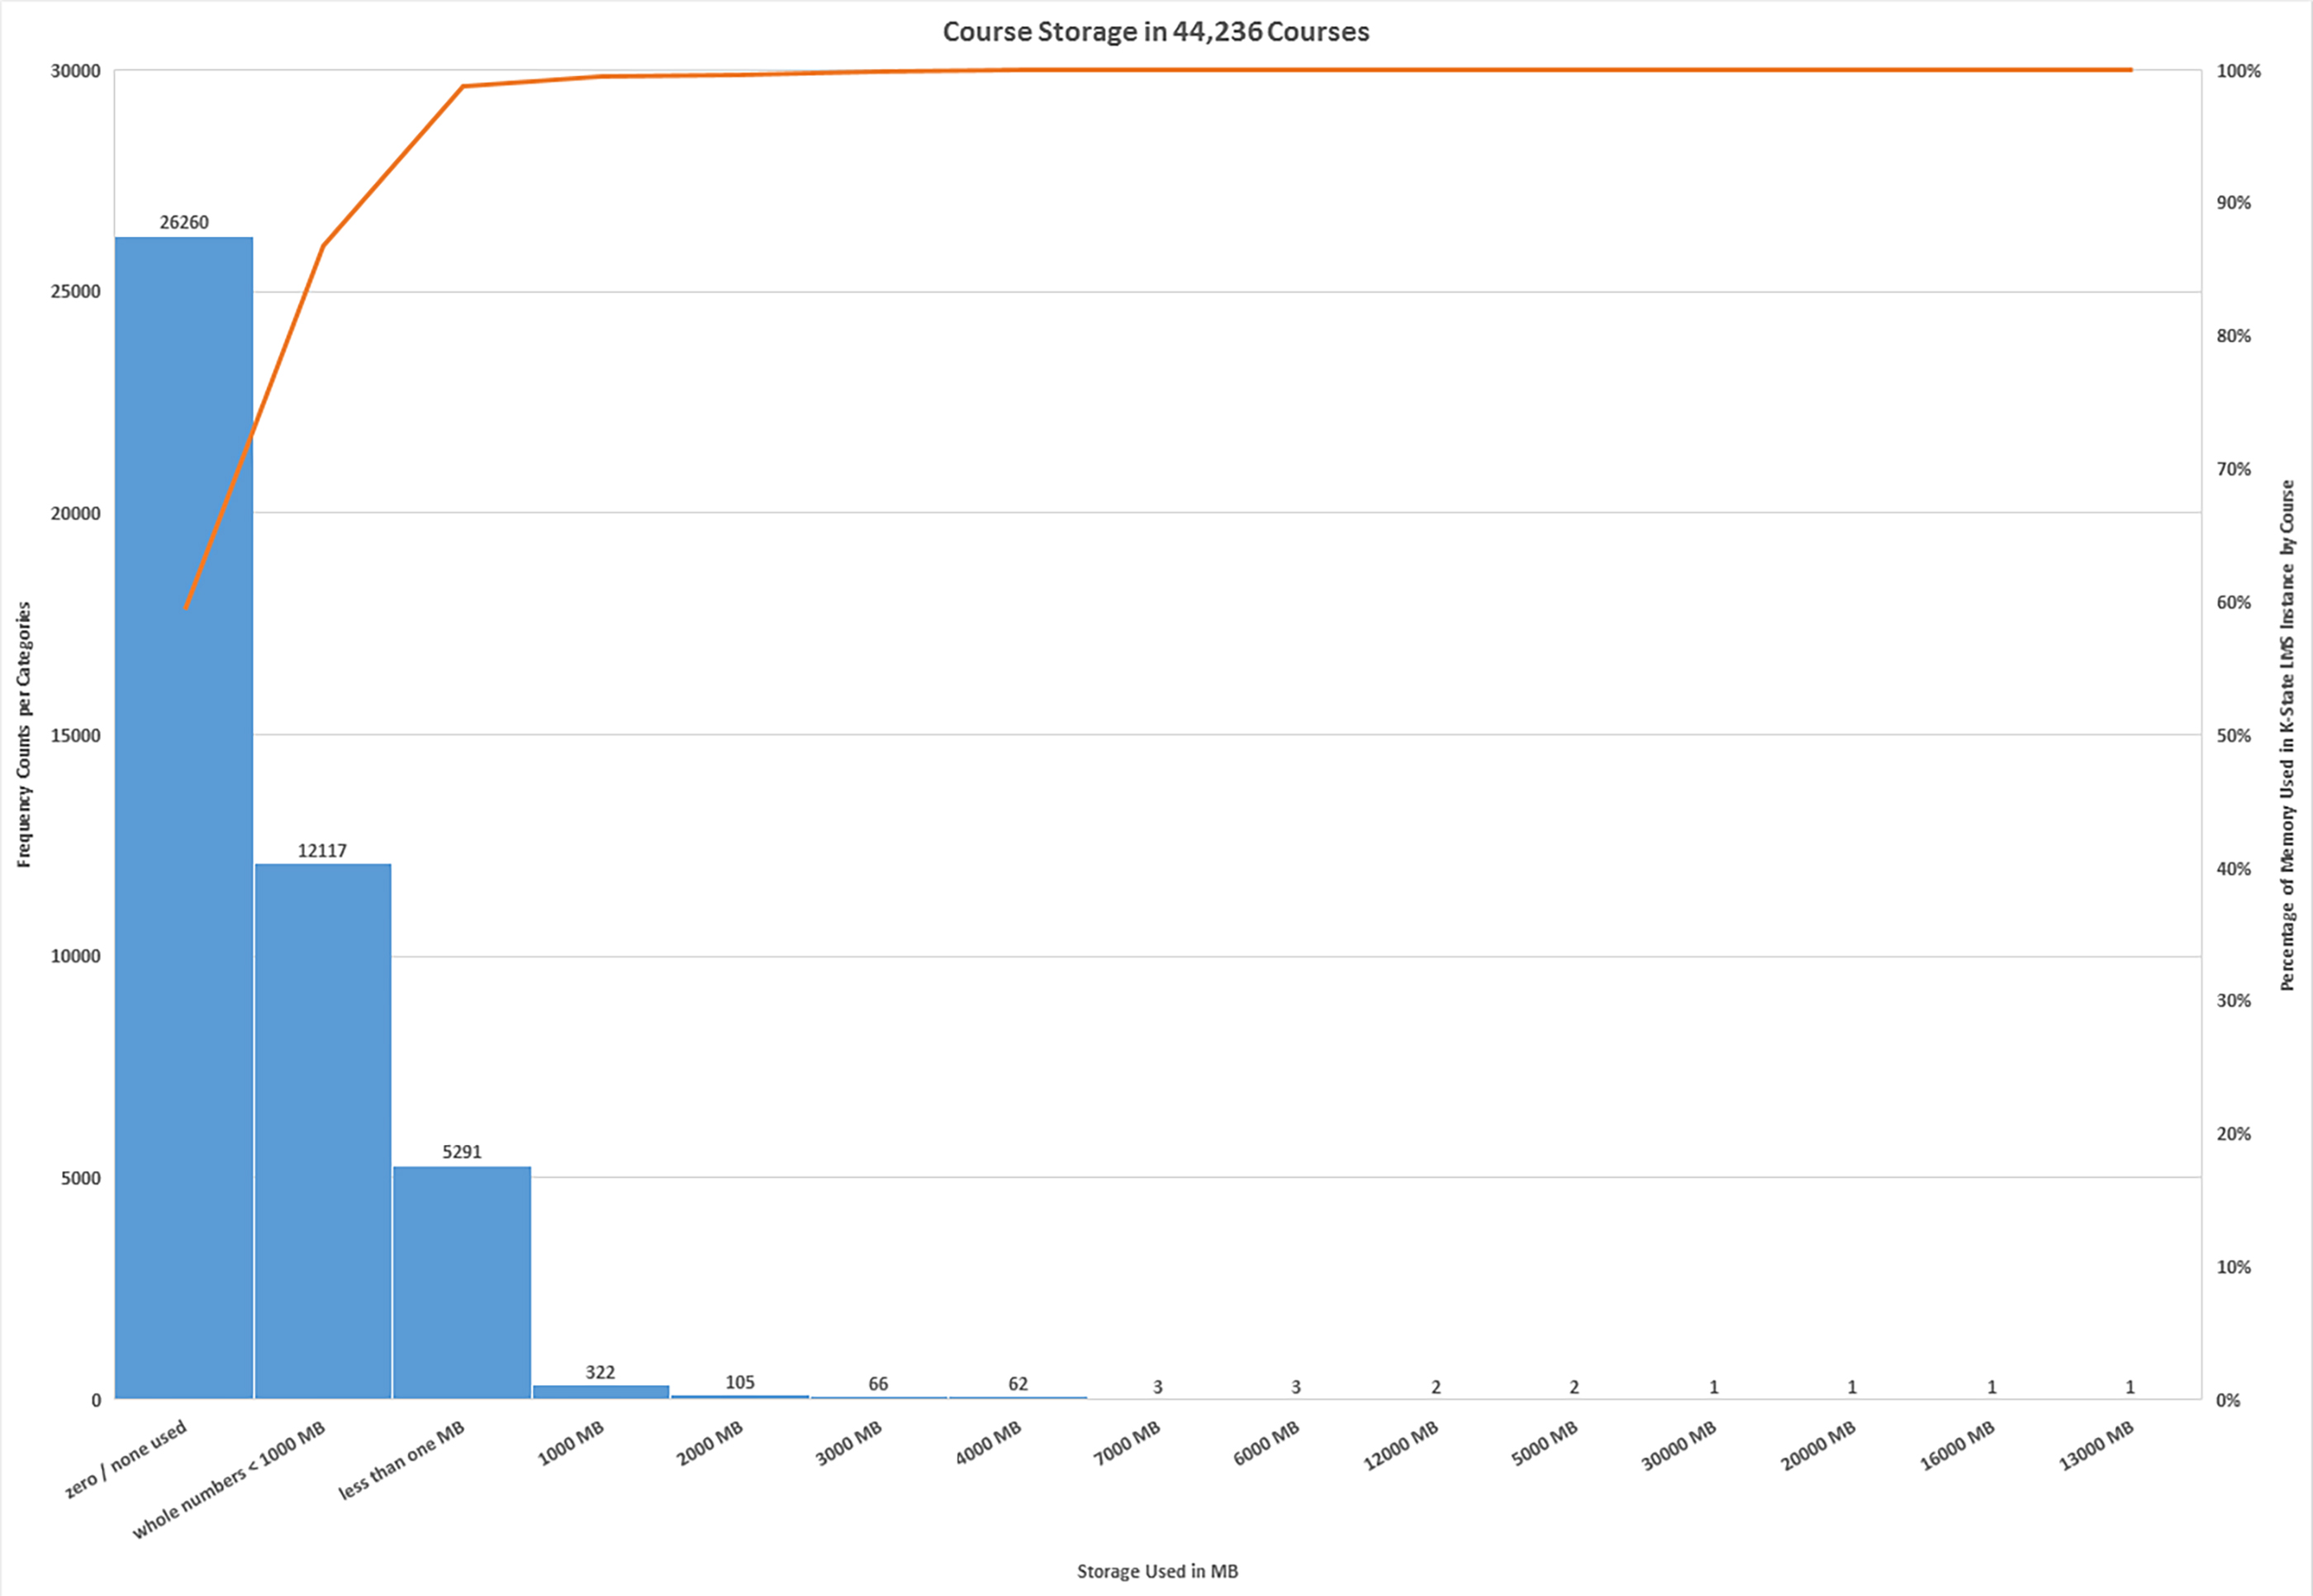
Interestingly, a majority of courses in this LMS instance use 0 MB of storage space followed by those using less than 1,000 MB of storage. Only a handful of courses use between 5,000 MB to 30,000 MB. This may be an indicator of proper LMS instance management given that there is a third-party service that handles video hosting and delivery. Also, some social video hosting sites are used for some video handling. Social media sites enabling crowd-sourced blogs, encyclopedias, and other elements are also external sources, which do not cost in terms of storage space on the LMS. Other servers at the university host some learning-based websites. Figure 5 summarizes the course storage frequency in descending order for 44,236 courses.
Figure 5: Course Storage in 44,236 Courses (in a Pareto Chart)
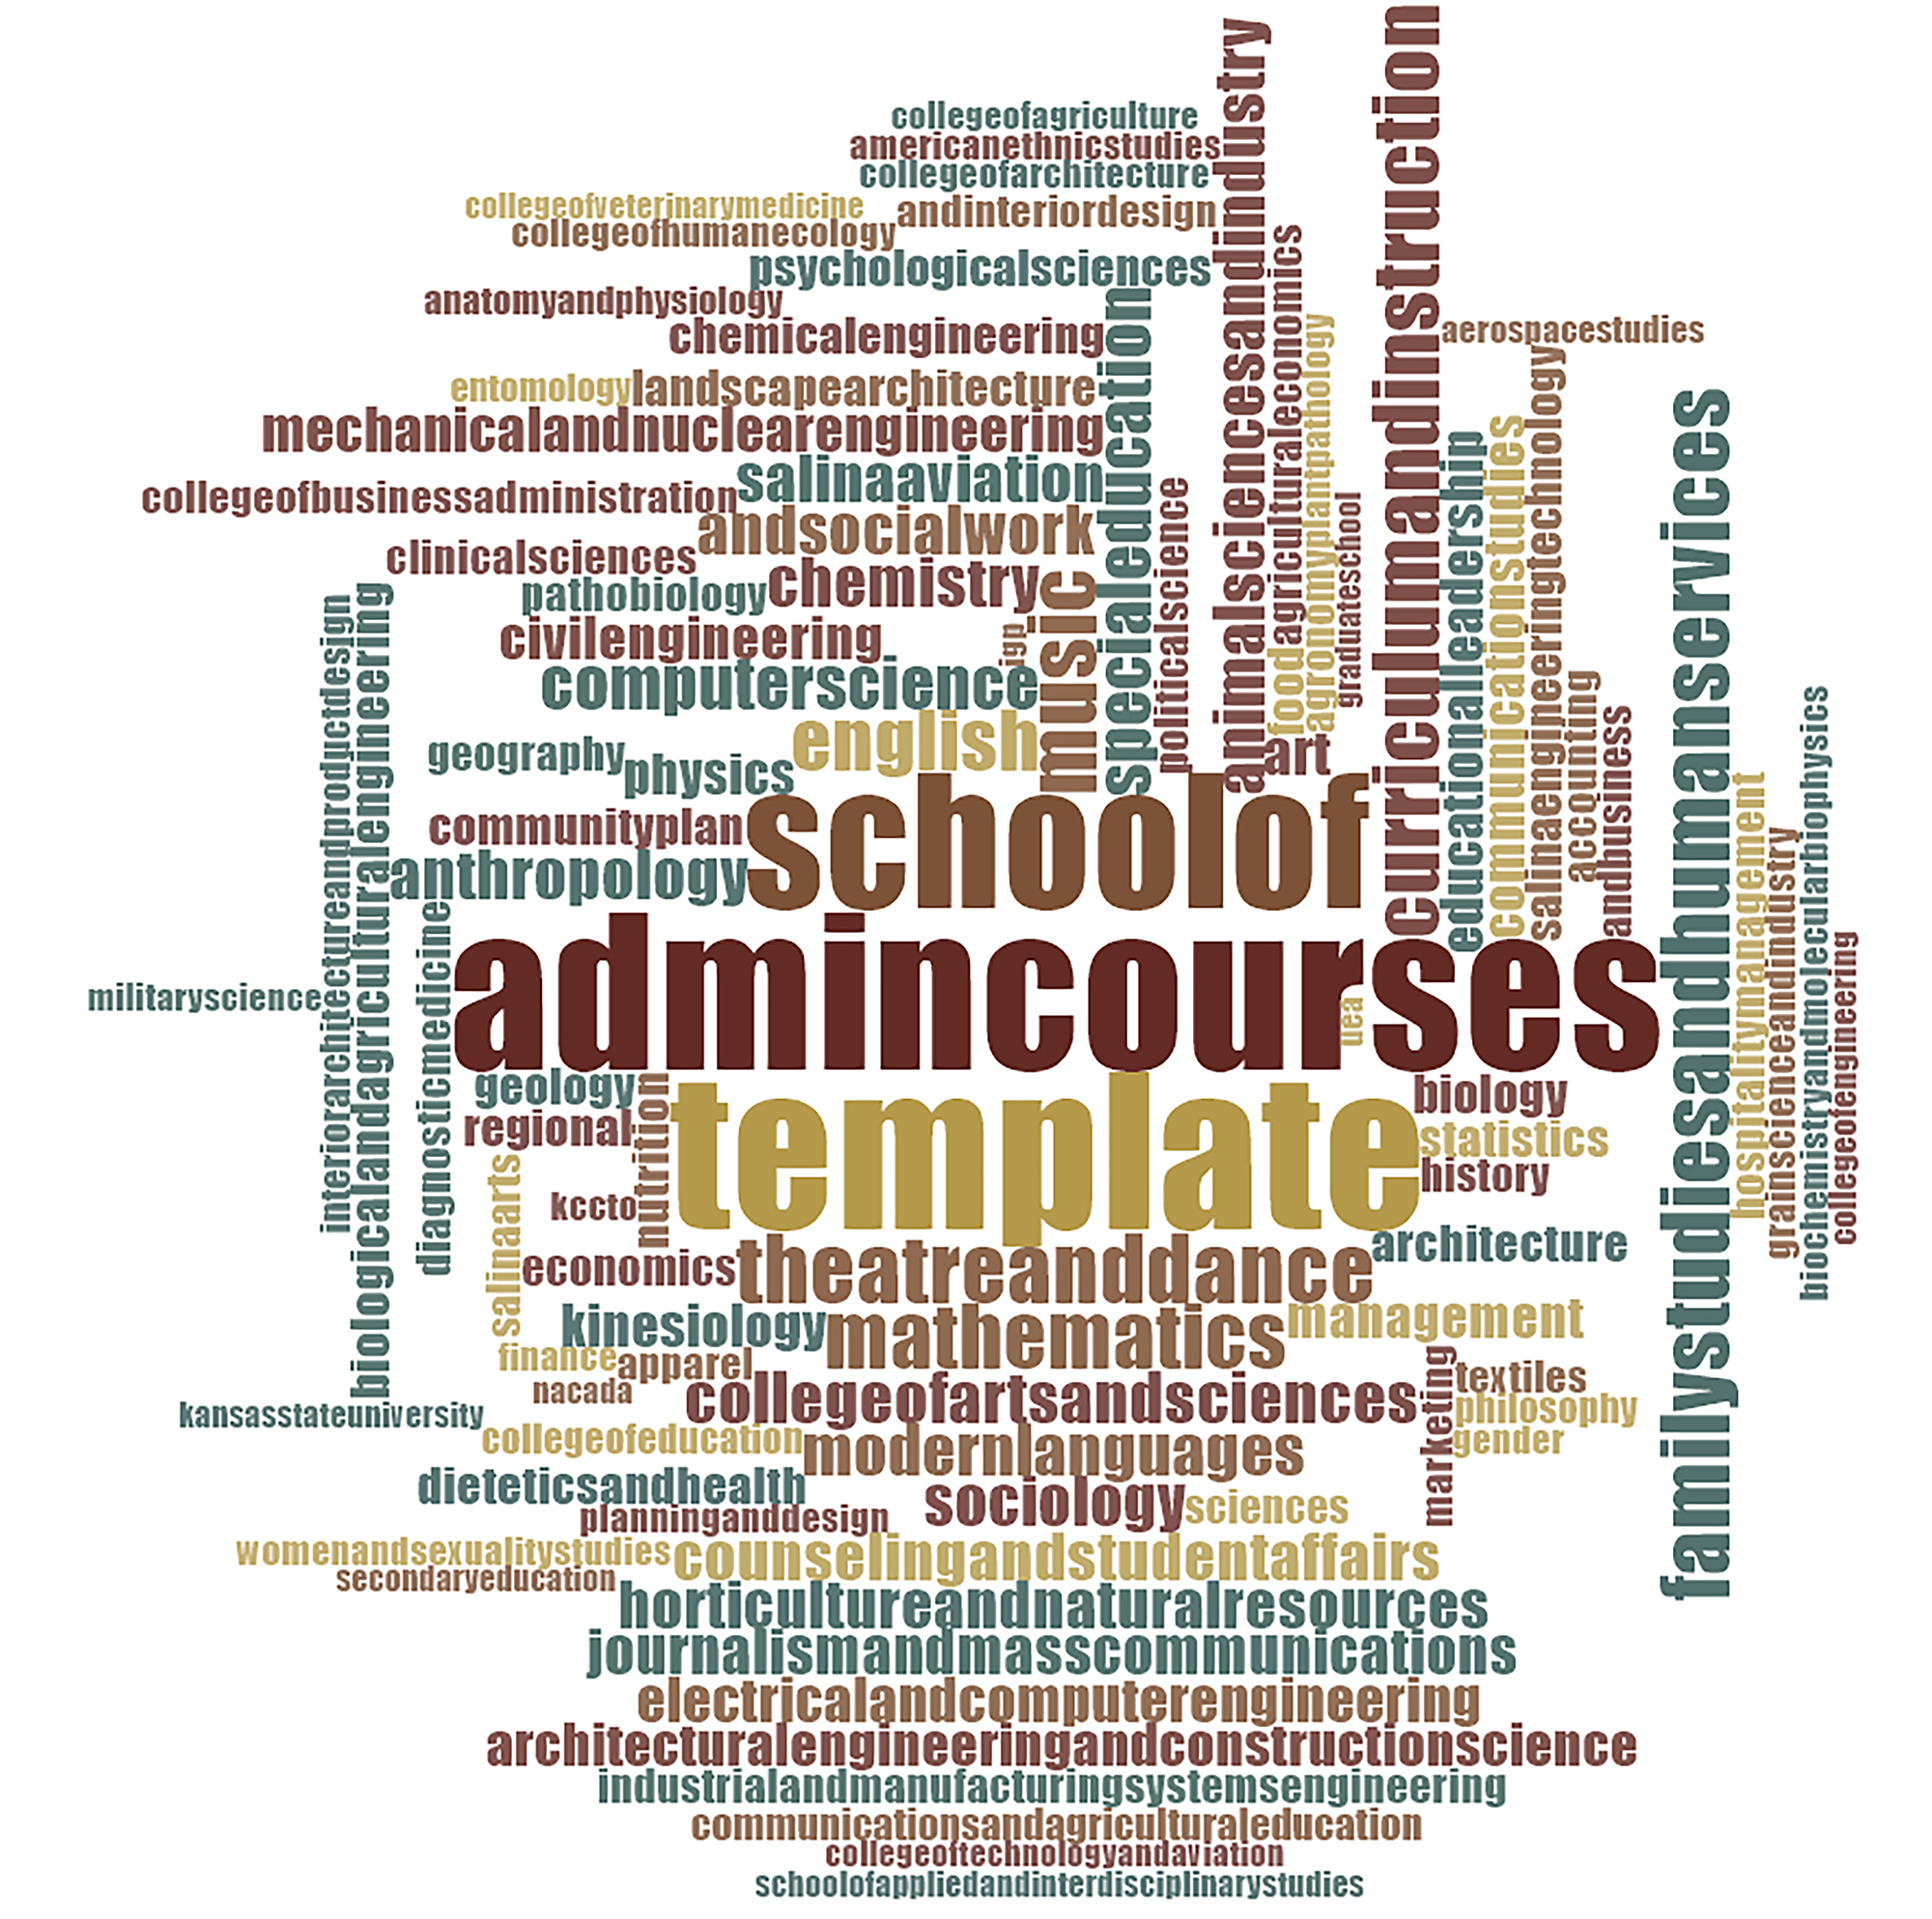
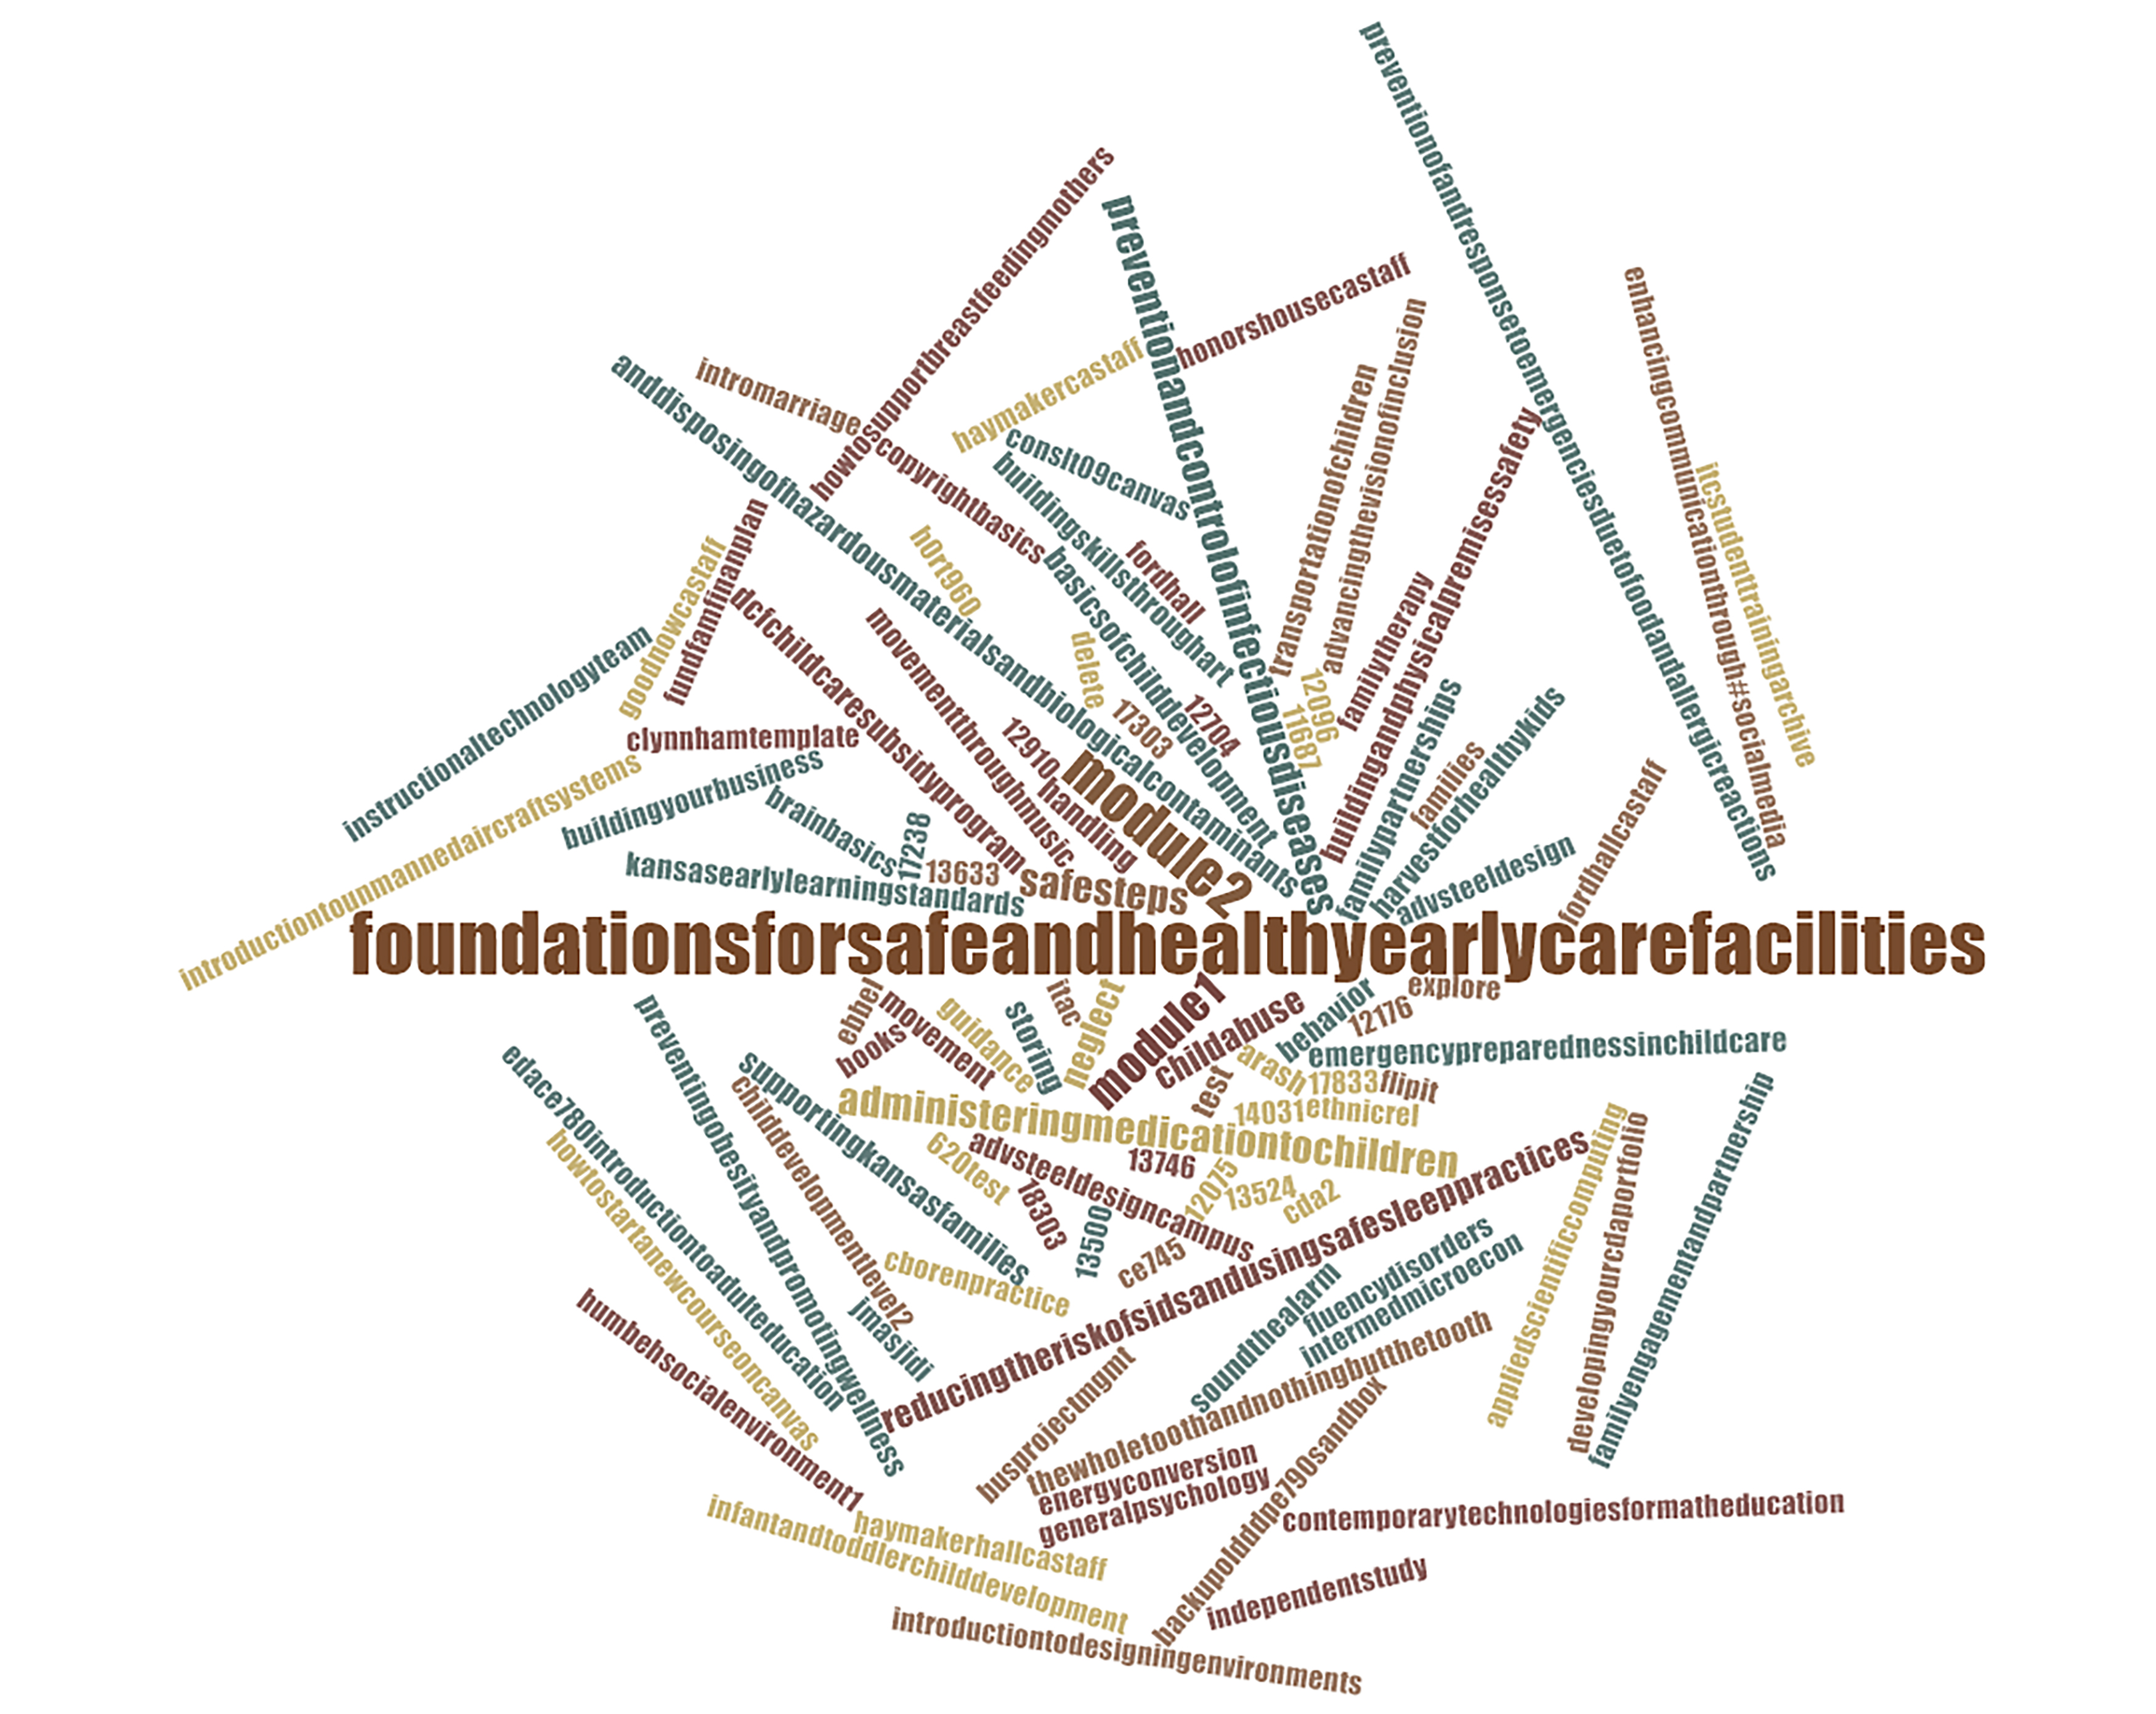
A listing of the course names mentioned for storage amount follows in Figure 6. These add a sense of color to the statistic. All empty spaces were removed, so that the respective course names would reflect as one-grams or unigrams, so they would be counted as units instead of separate pieces. Two items were removed by adding to the stopwords list: “top” (short for “topic”) and “intro” (short for “introduction,” indicating the level of the course).
Figure 6: Names of Courses Listed for Storage Measures (in a Word Cloud)
About Developer Keys Activated in the LMS Instance
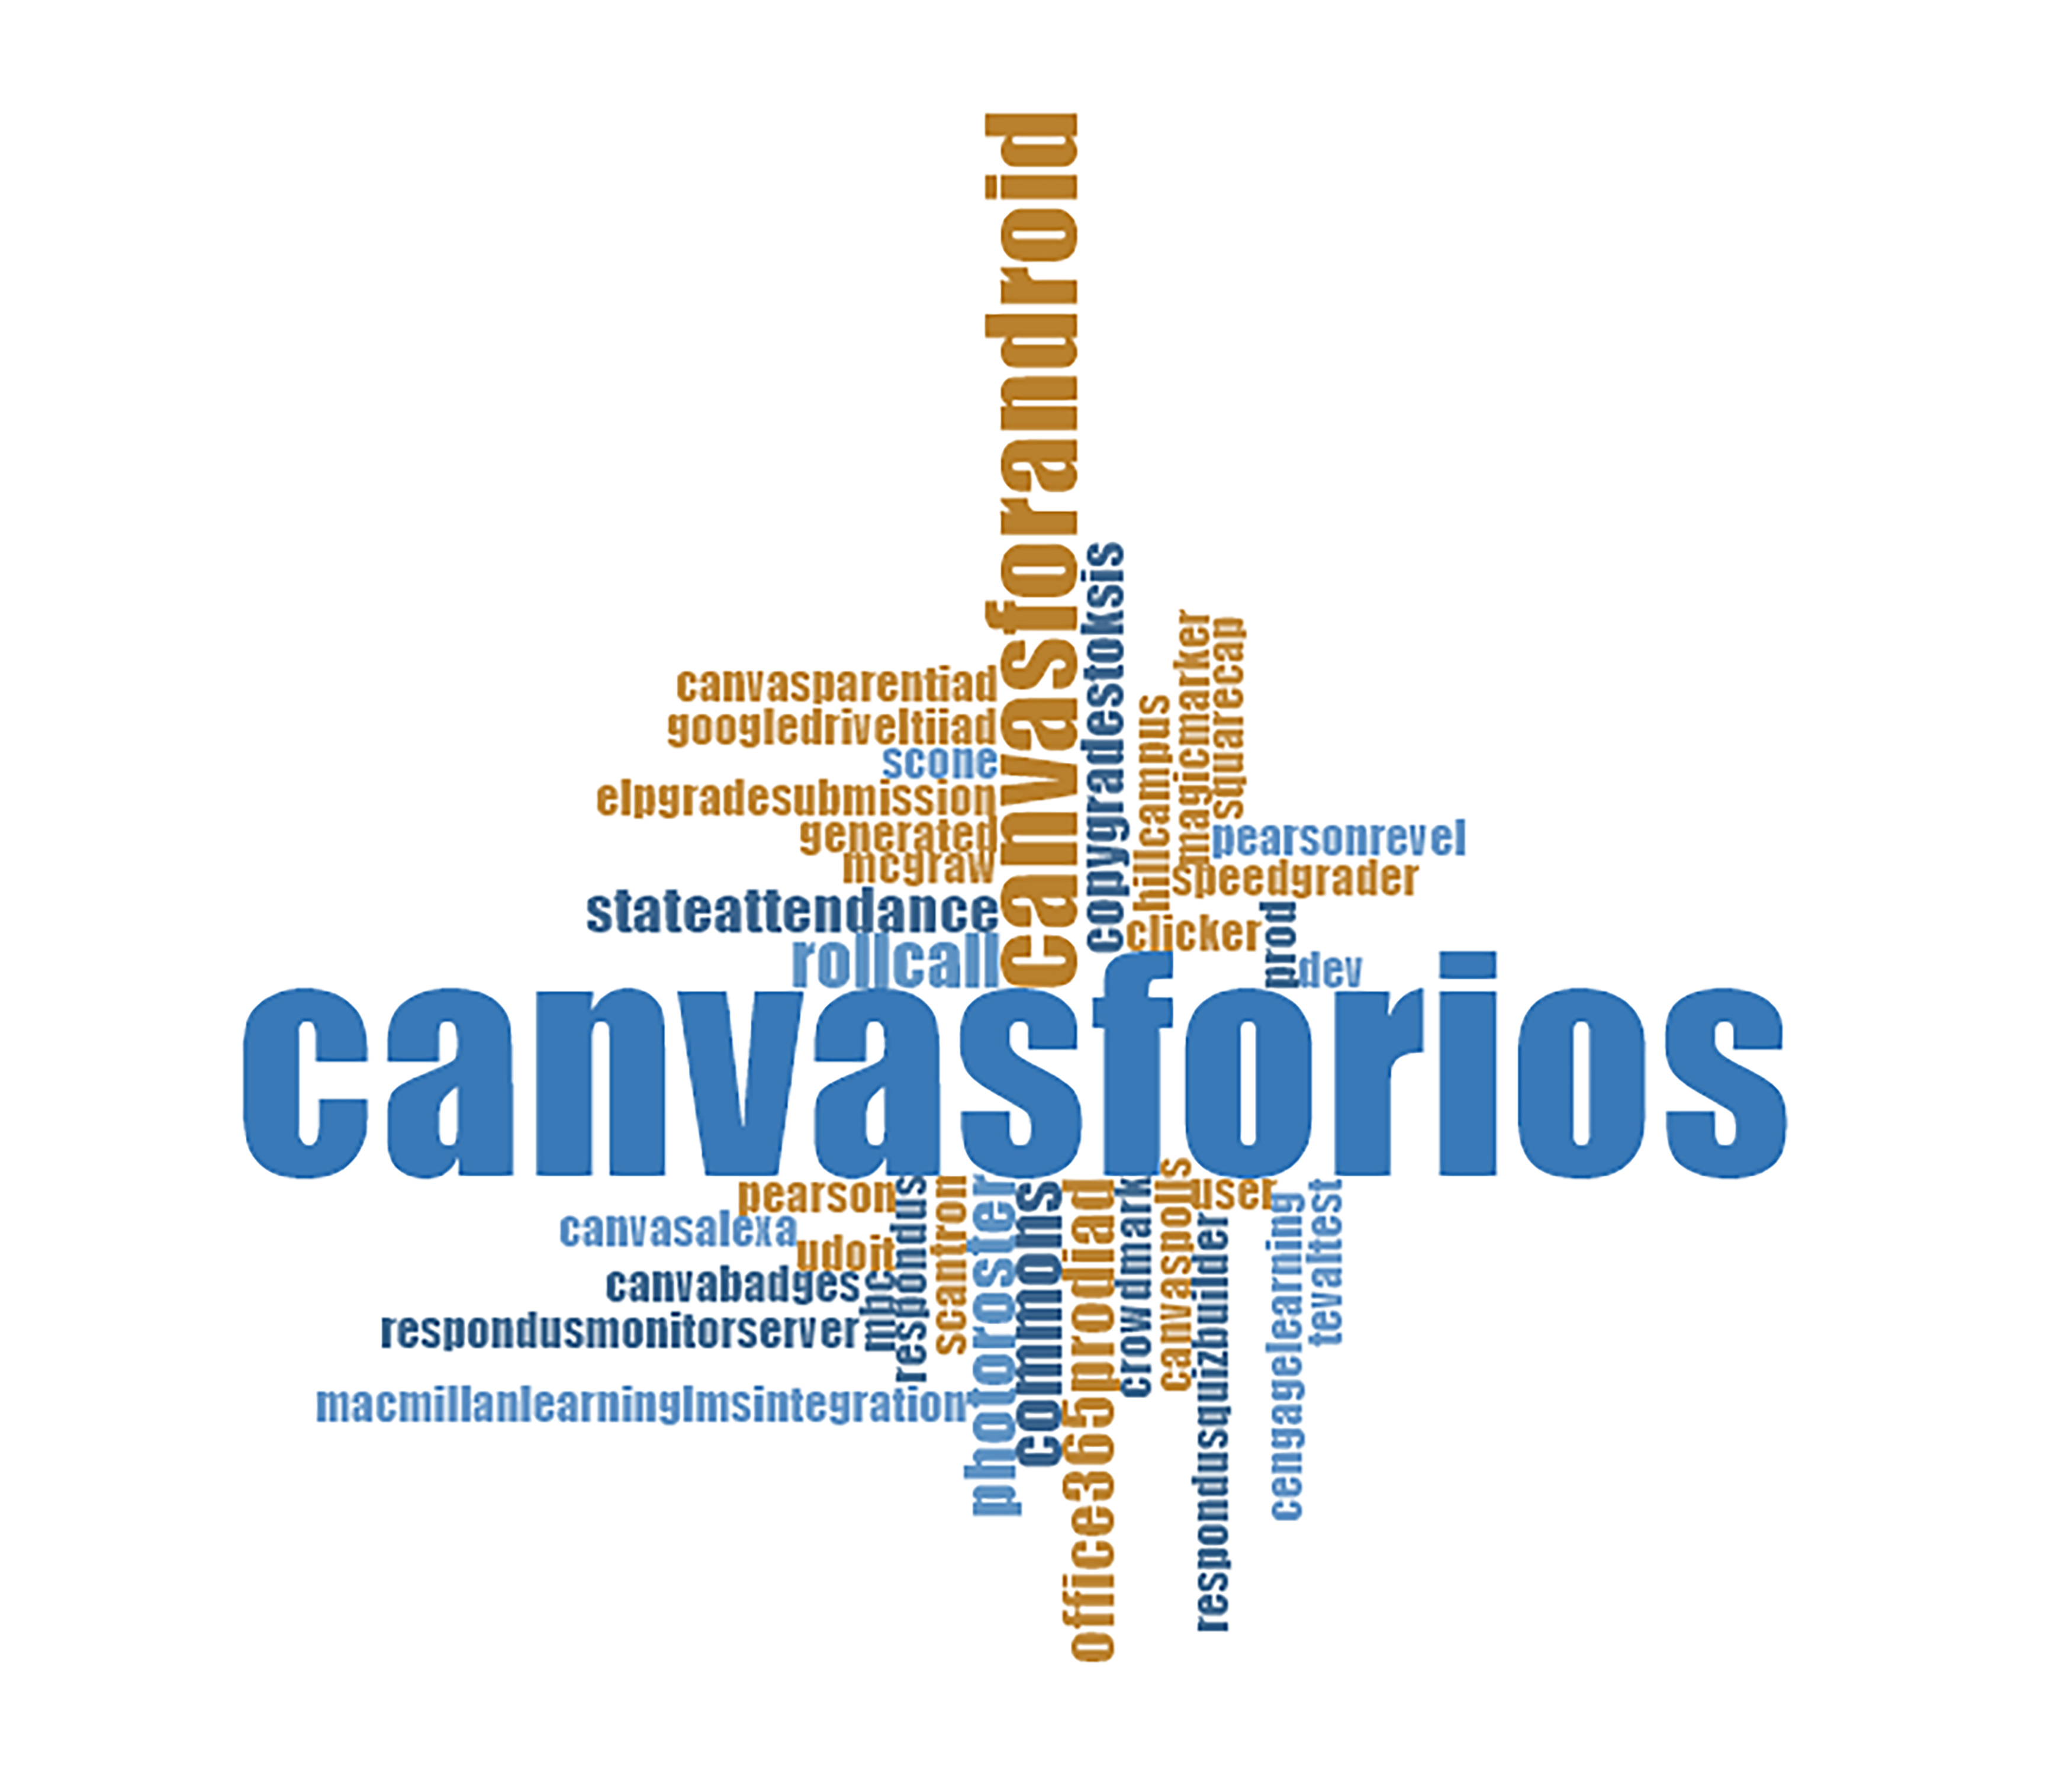
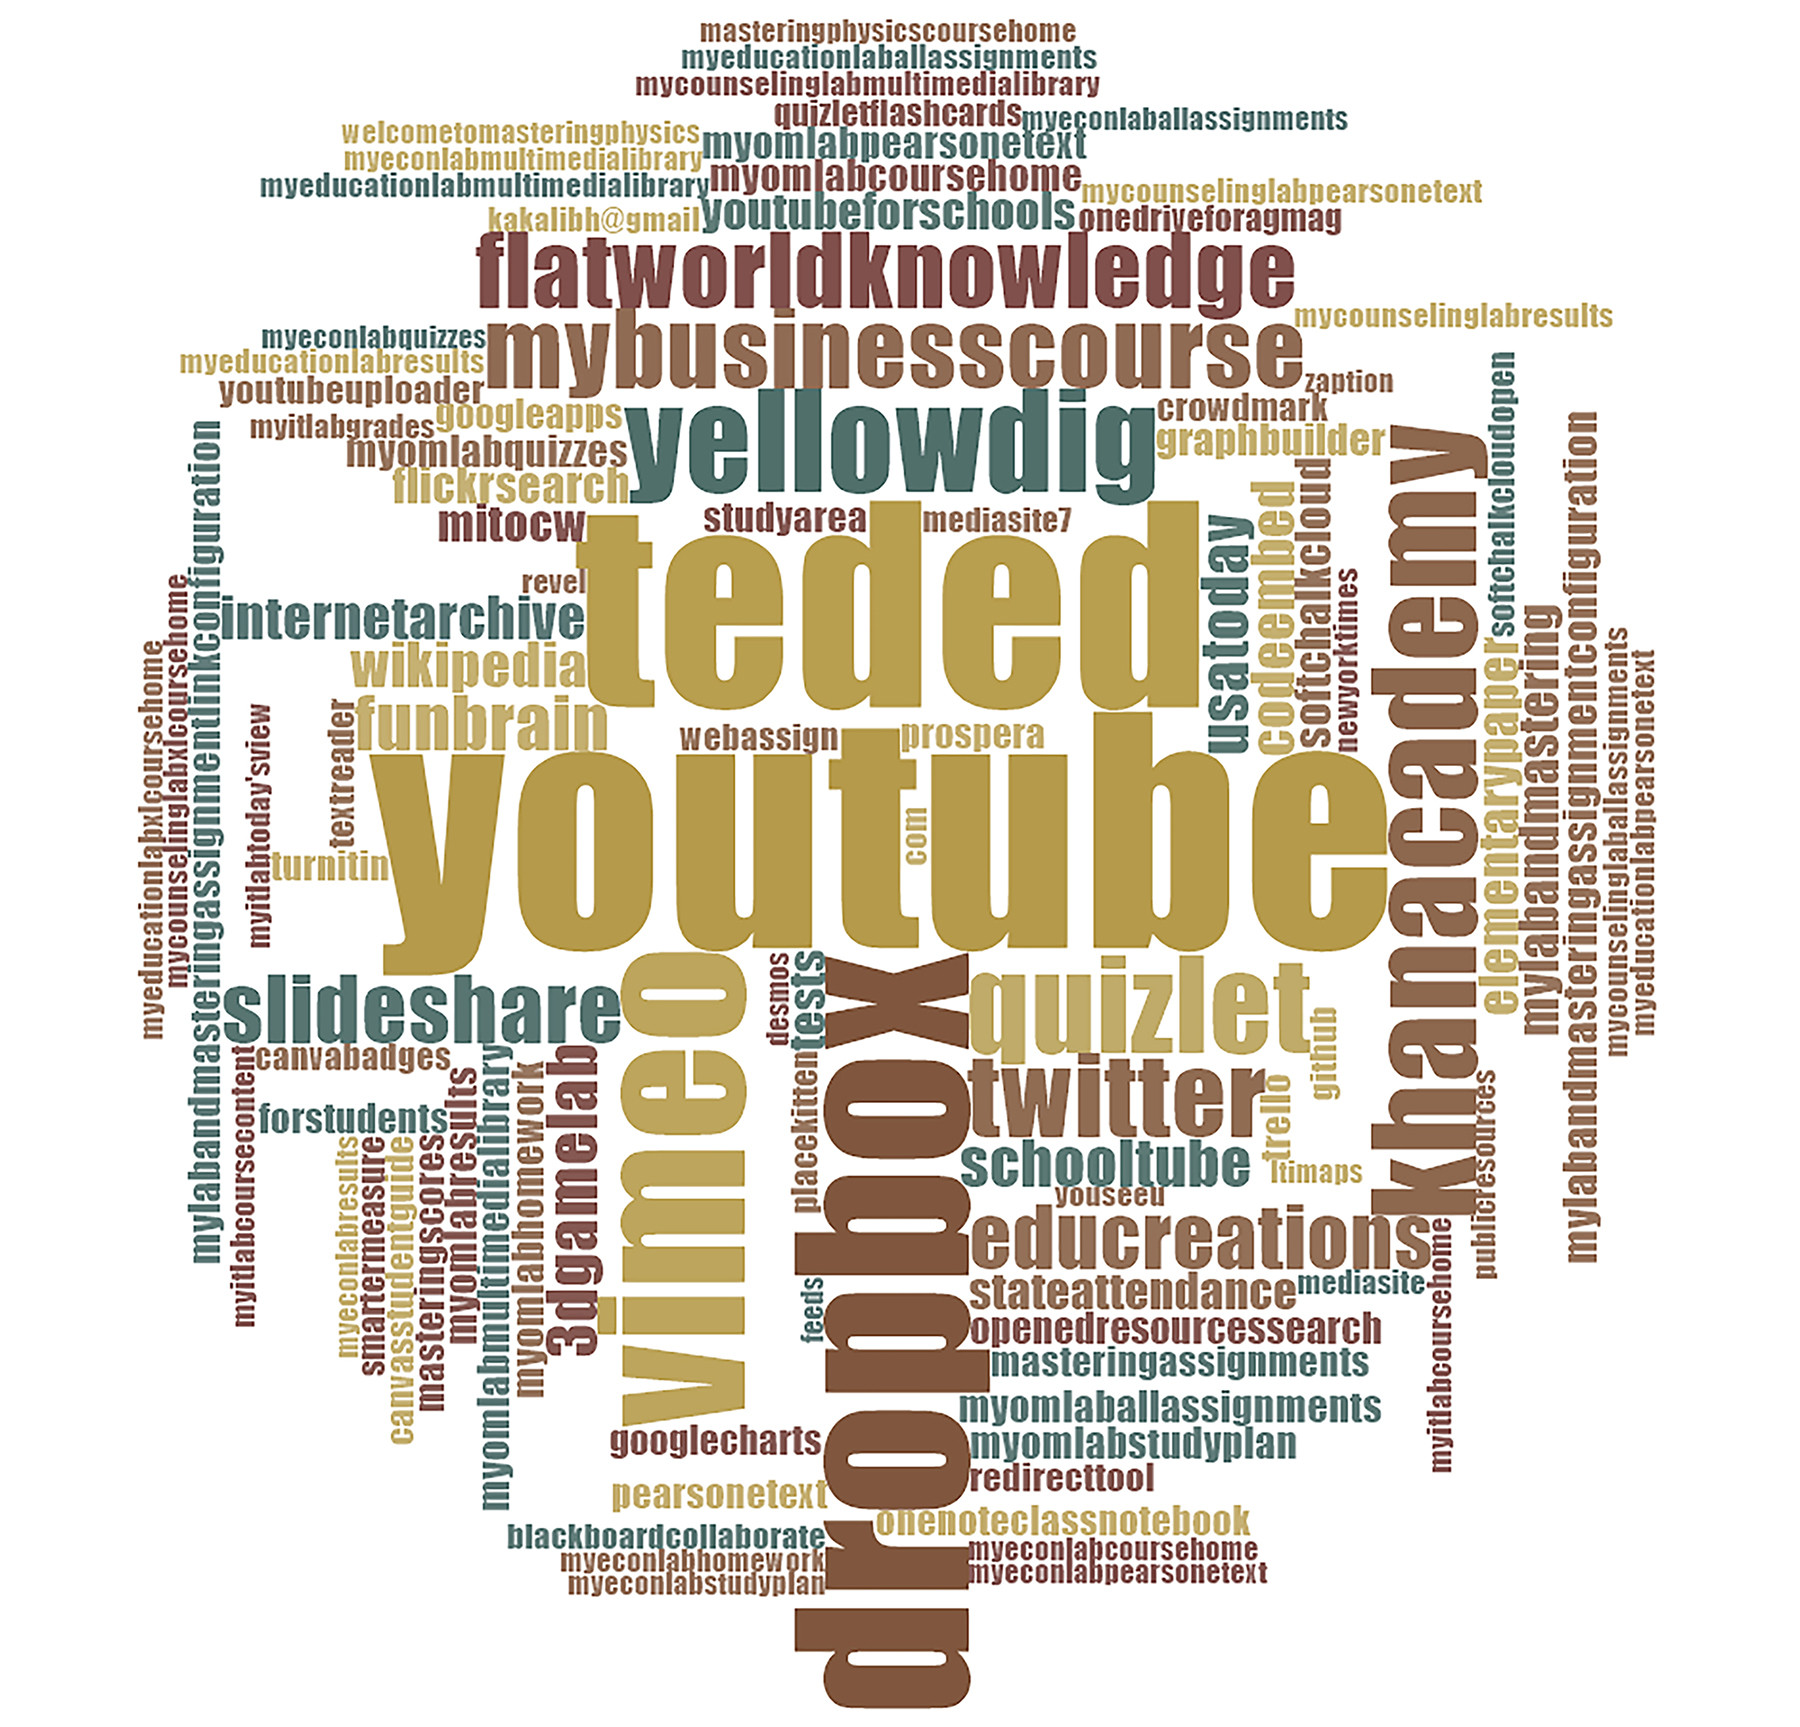
In the whole LMS instance lifespan, there were 69,775 individual moments when user access tokens were activated, the most recent ones in August 2017 (the earliest ones from 2014). Figure 7 shows which ones were the most popular in a word cloud (based on word frequency counts). All accounts were in the “active” state at the time of the data extraction. The list of activators of developer keys were both known developers, faculty, and some staff.
Figure 7: Activated User Tokens in the LMS Instance (in All Terms)
About Unused Courses
The reports section in the Canvas LMS enables a cumulative count of unused courses. These include 4,069 unused courses. Of these “unused” courses, 3,973 were “unpublished” and 67 were “active” (which probably means “published”). This data is from Fall 2015, in reference to courses created in June 2015. See Figure 8 for more.
Figure 8: States of 4,069 Unused Courses in the LMS Instance (in Fall 2015)
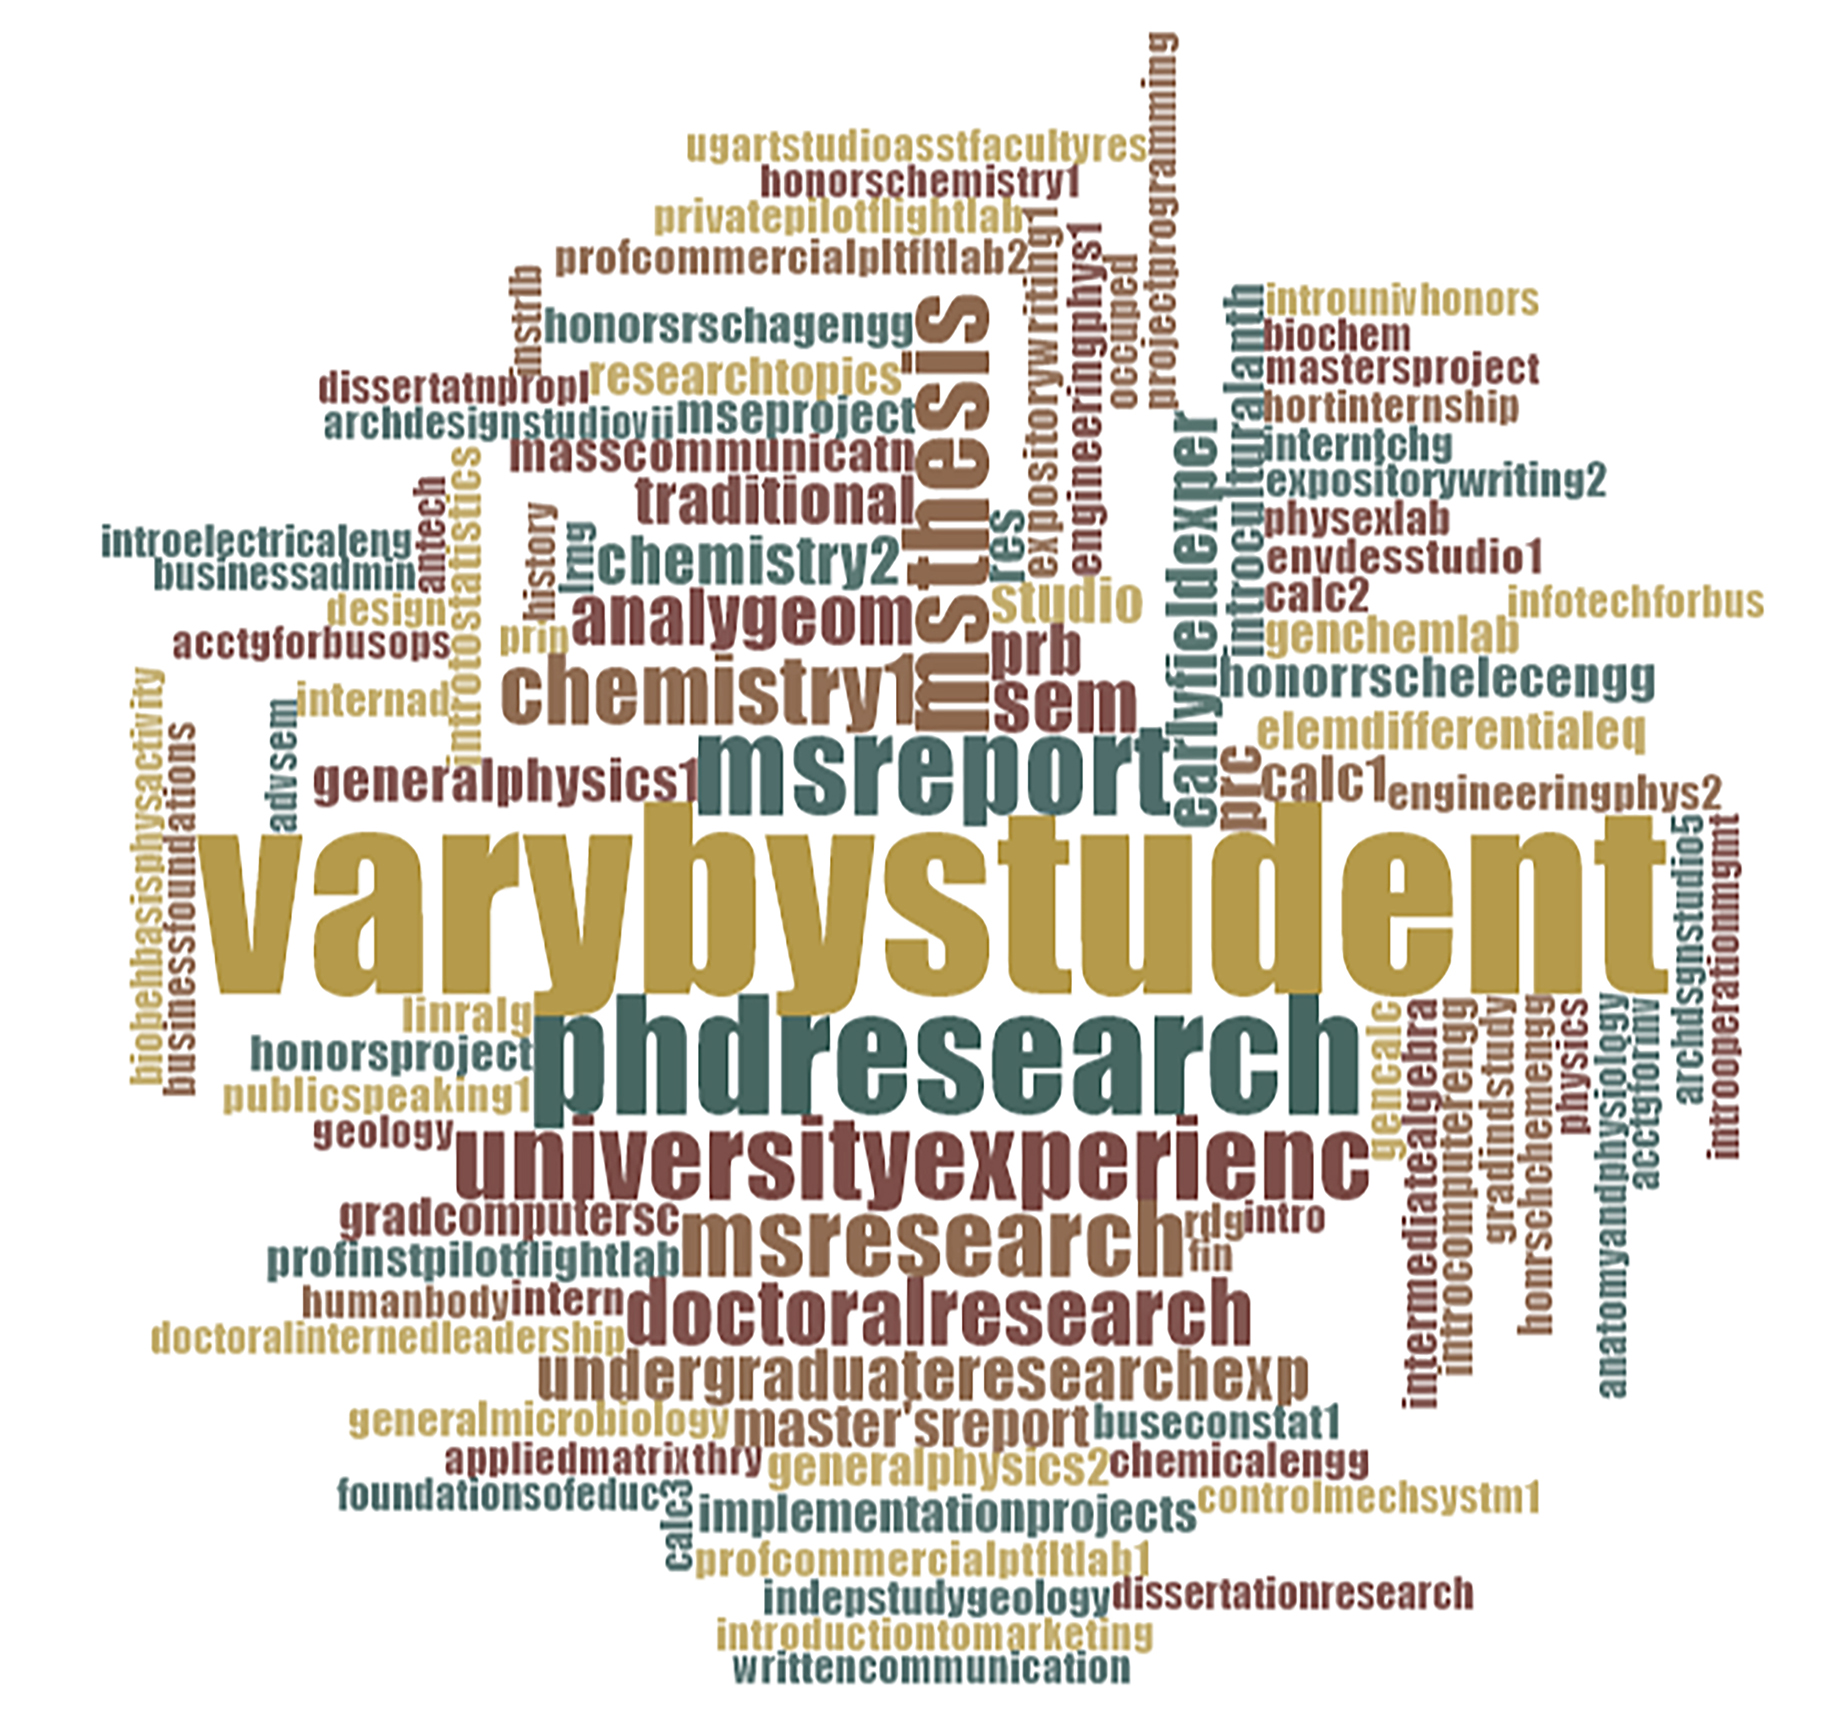
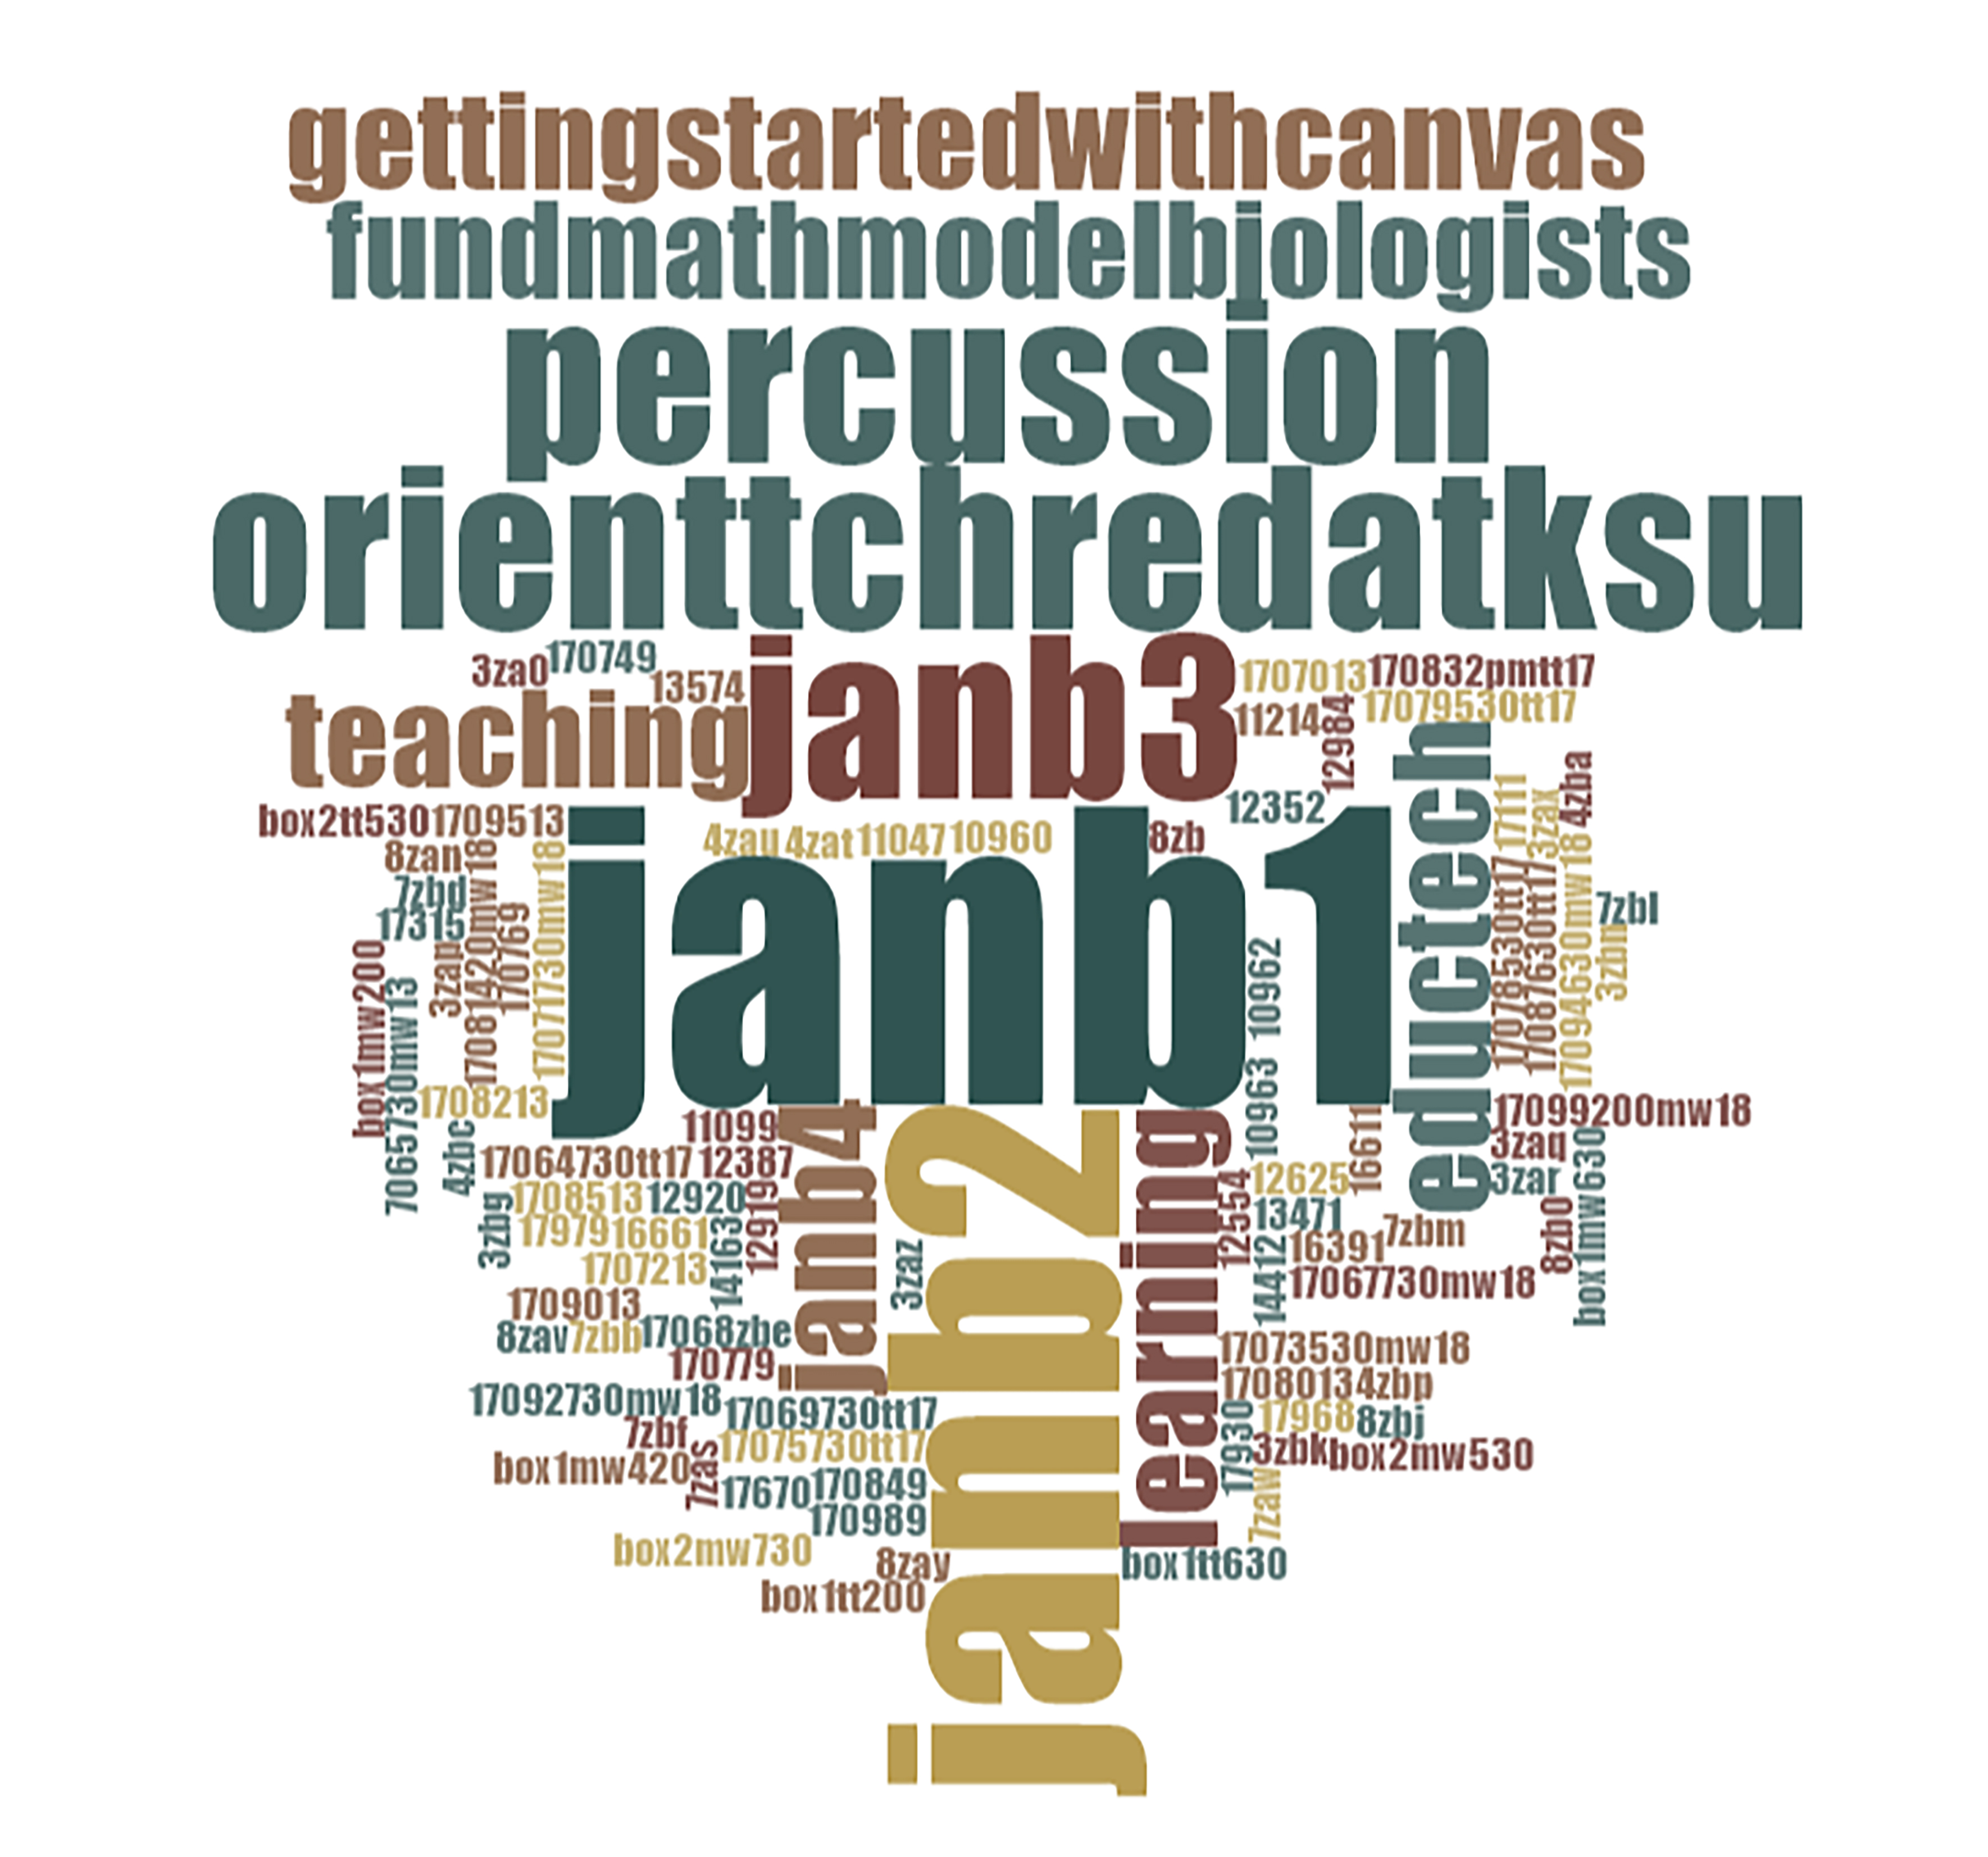
To capture a sense of the unused courses, a word cloud was created (Figure 9) after closing the space gaps in names so the respective names could be treated as one-grams or unigrams.
Figure 9: Names of Unused Courses in a Word Cloud by Frequency Count (Fall 2015)
About Student Outcomes in Assignments
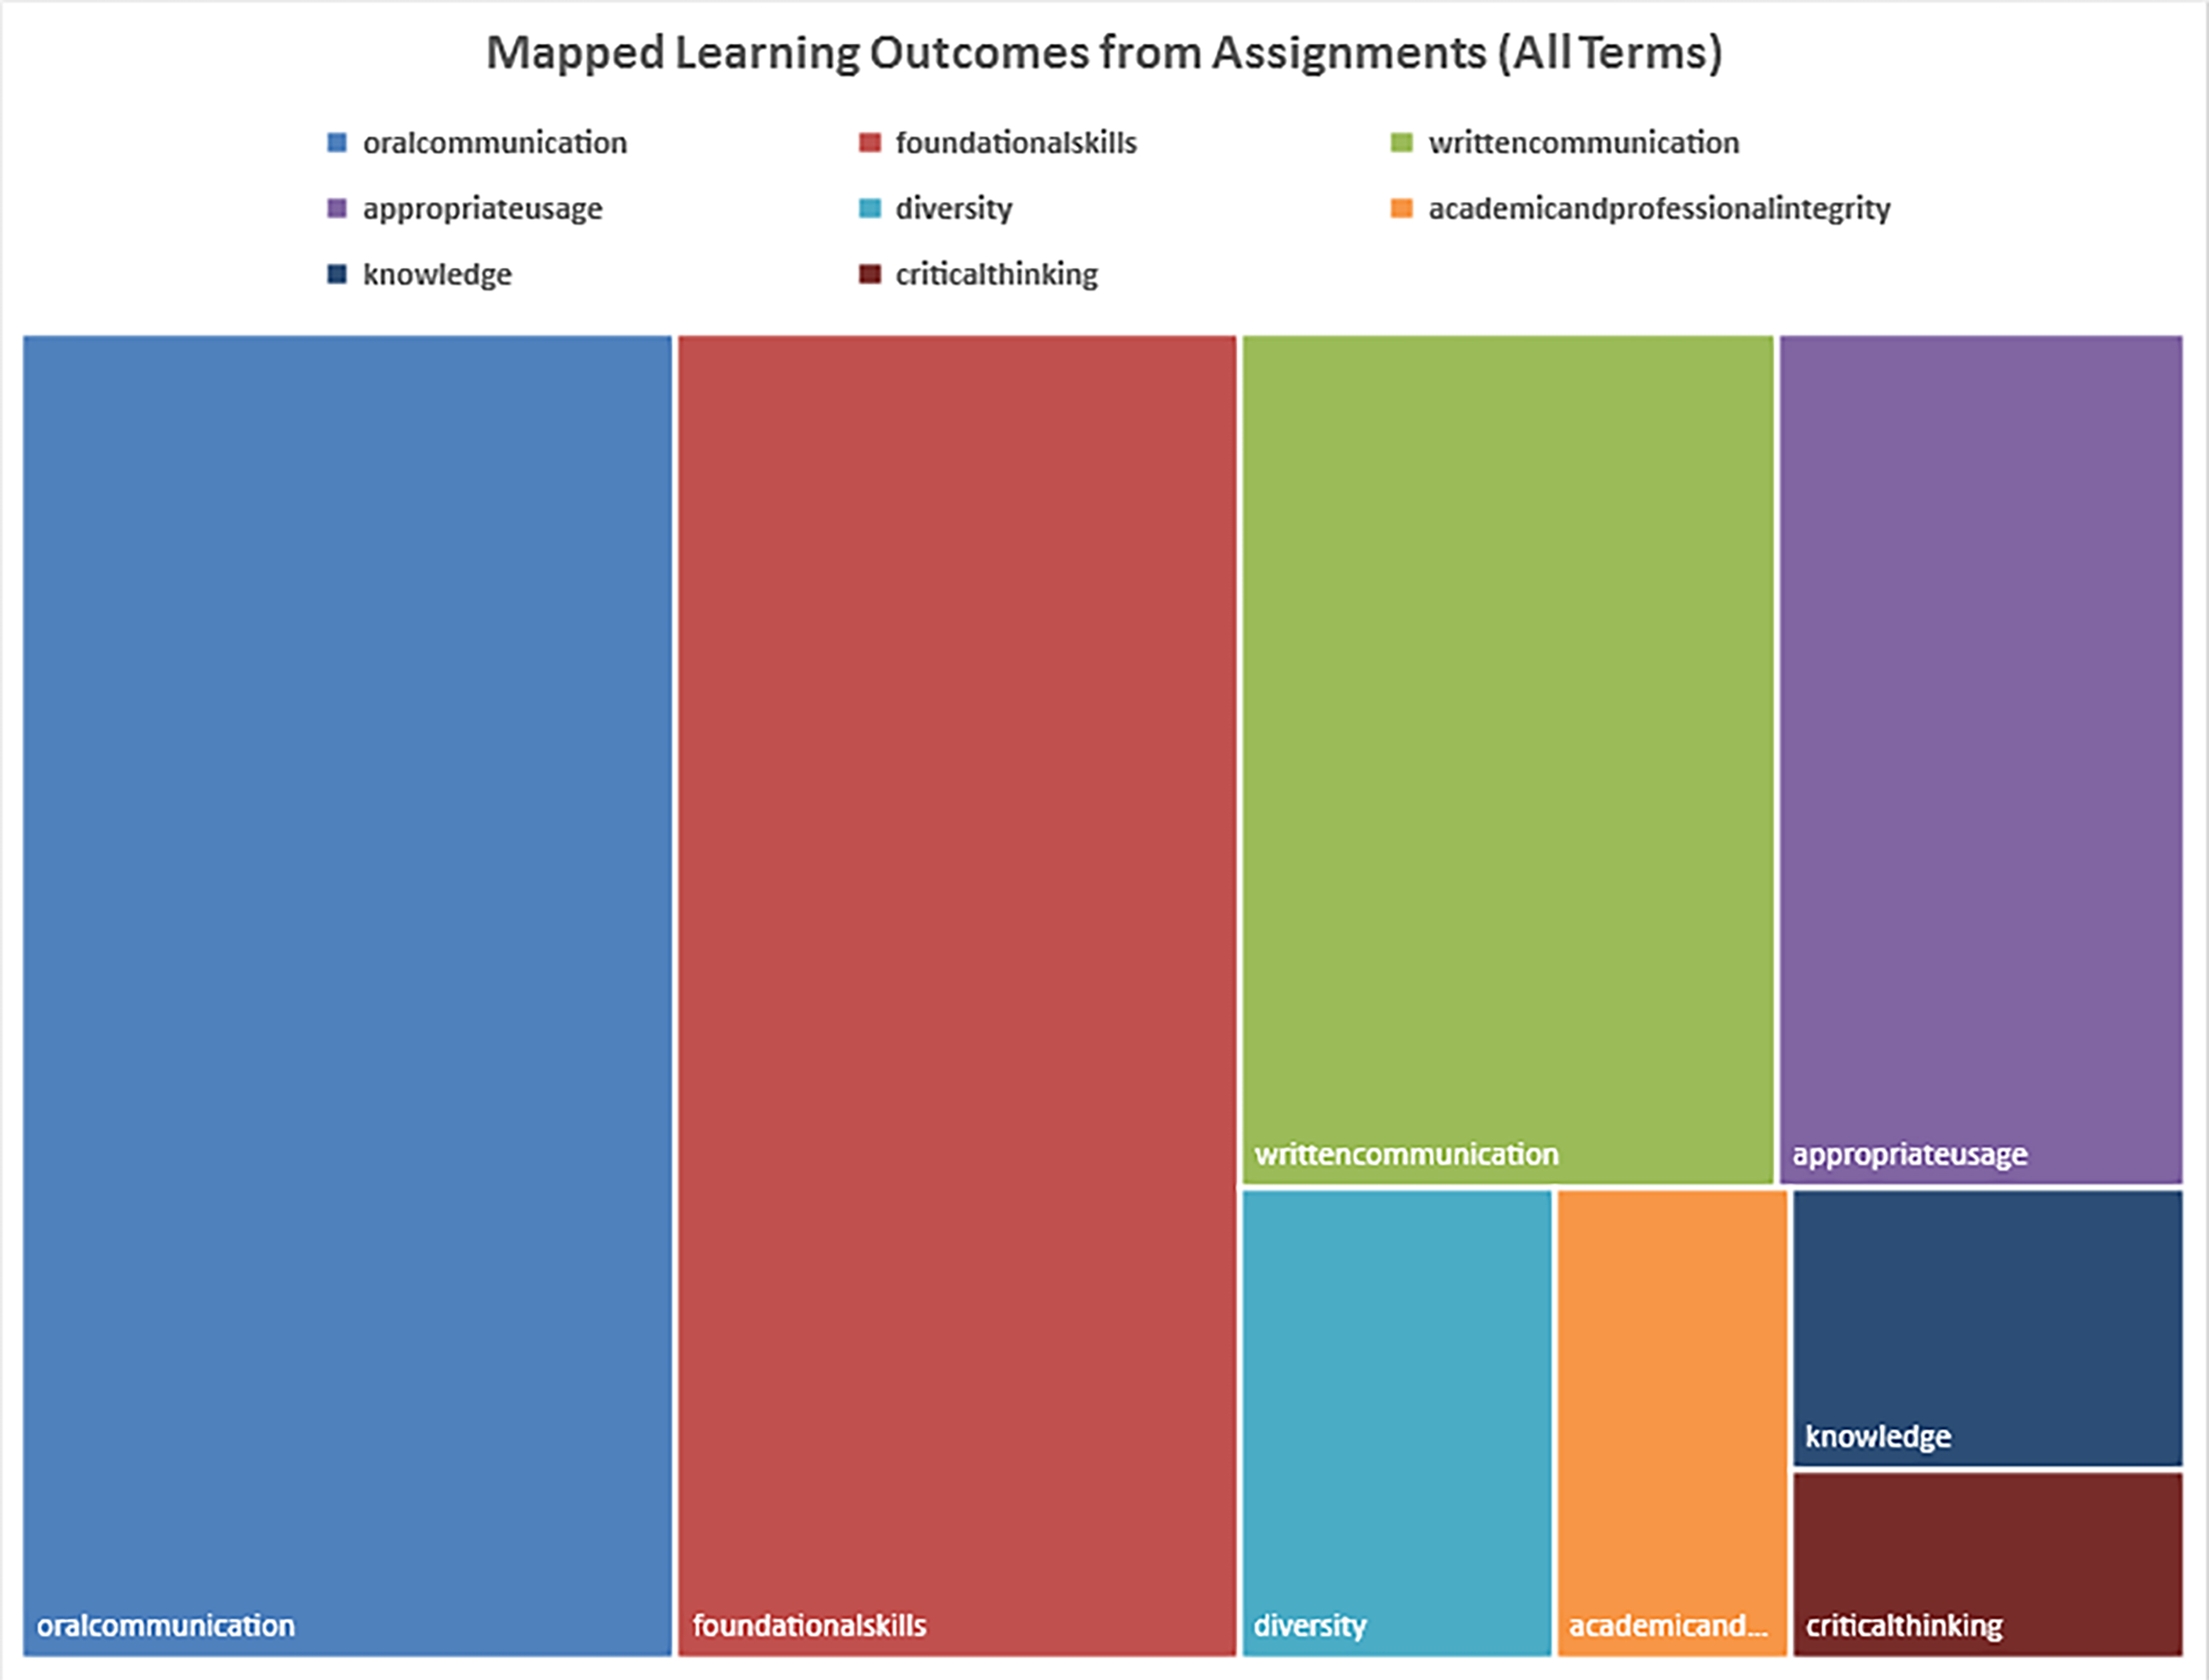
Student outcomes extracted over “All Terms” found 231 outcomes linked to assignments. These were, in descending order of frequency, as follows: Oral Communication, Foundational Skills, Written Communication, Appropriate Usage, Diversity, Academic and Professional Integrity, Knowledge, and Critical Thinking. (Figure 10) These terms are representations in the data table, likely not the formal names.
Figure 10: Recorded Learning Outcomes from All Terms (in a Treemap Diagram)
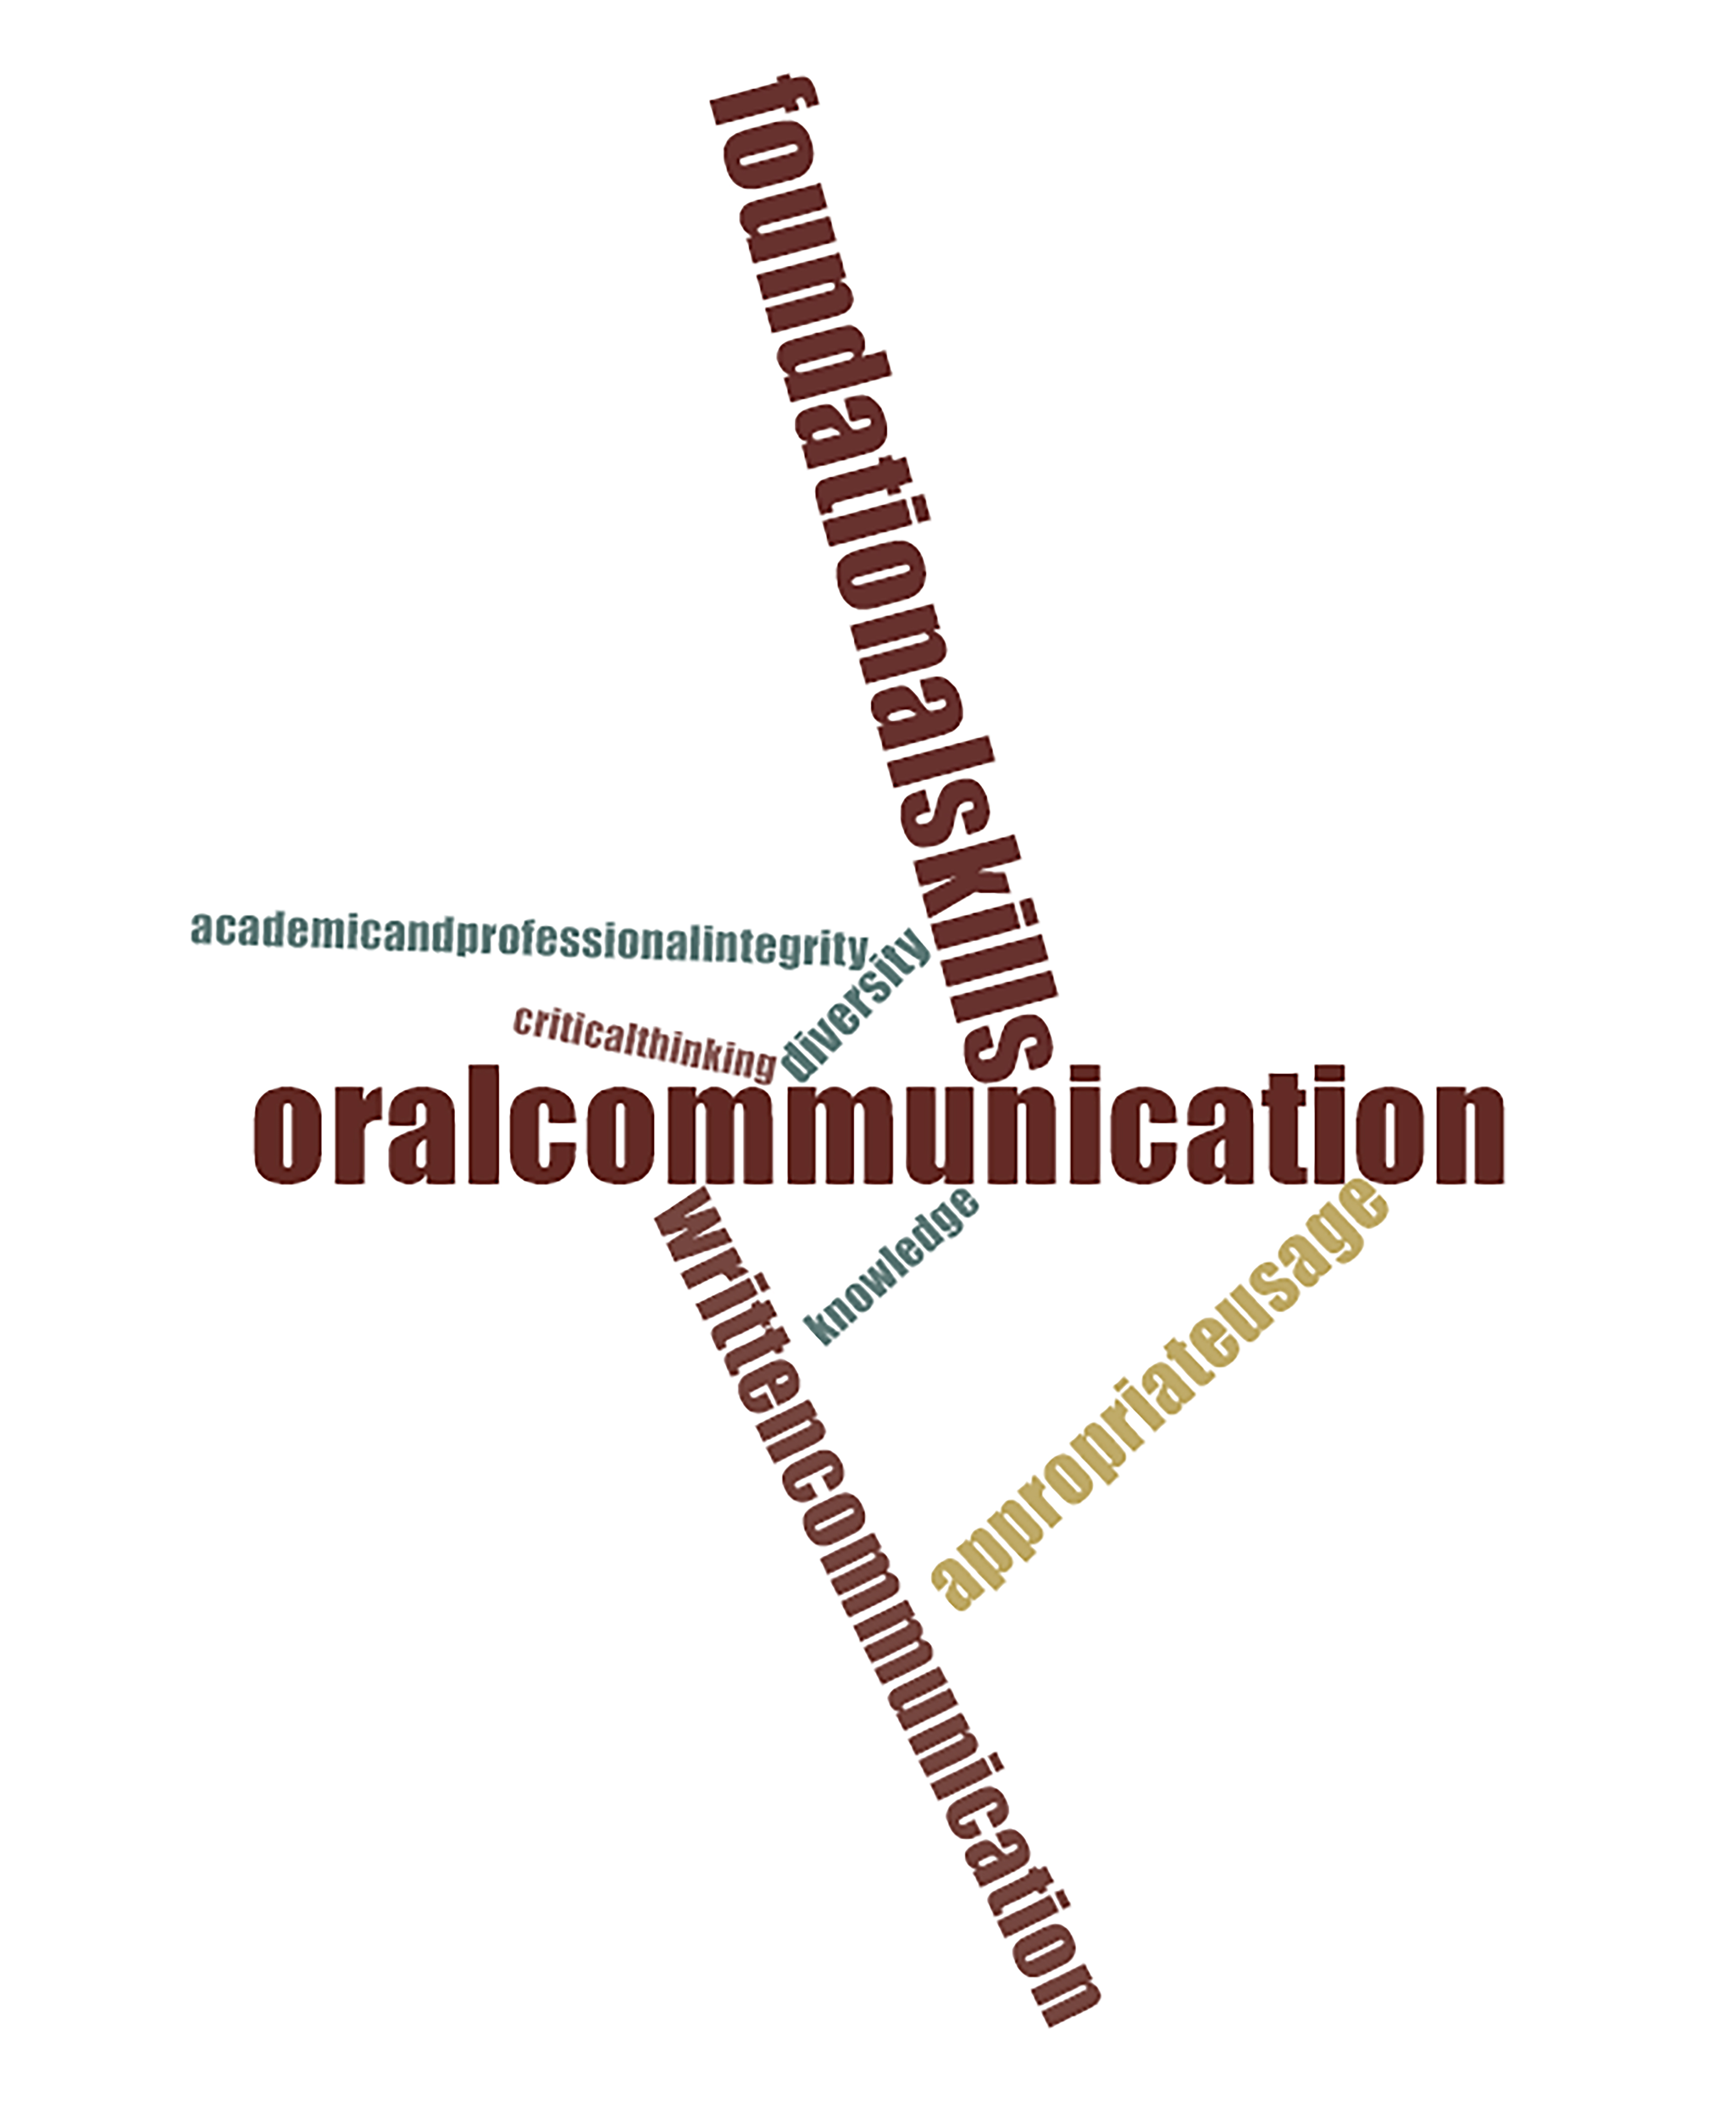
A word cloud version of Figure 11 data follows.
Figure 11: Recorded Learning Outcome Results from All Terms (in a sparse Word Cloud)
About Recently Deleted Courses
In Spring 2017, as of July 2017, there were 180 deleted courses. Some of the course names of these deleted courses follow in Figure 12.
Figure 12: Recently Deleted Courses in a Word Tree by Frequency Counts (Spring 2017)
About Public Courses
So which of the courses were “public” in Spring 2017? According to the report data, there were 57 public courses—which likely means made publicly visible in a broad sense (not “published” as in to the campus—because the numbers would be much higher for the latter). Only five of the 57 public courses had formal start dates: three in 2016 and two in 2017. In Figure 13, there seems to be some incoherence in the naming of some public courses…or some machine auto-naming (without full human coherence).
Figure 13: Public Courses in the LMS Instance (Spring 2017)
About Tool Type Names
A Learning Tools Interoperability (LTI) report is also available to indicate activated third-party tools. This report does not include deleted objects (although it is possible to run the report with deleted objects included). There were 3,377 activations of tool types. (For more on the IMS Global specification for learning tools interoperability, please visit their site.)
Figure 14: Tool Type Names in the LTI Report Data Table (All Terms)
About Unpublished Courses
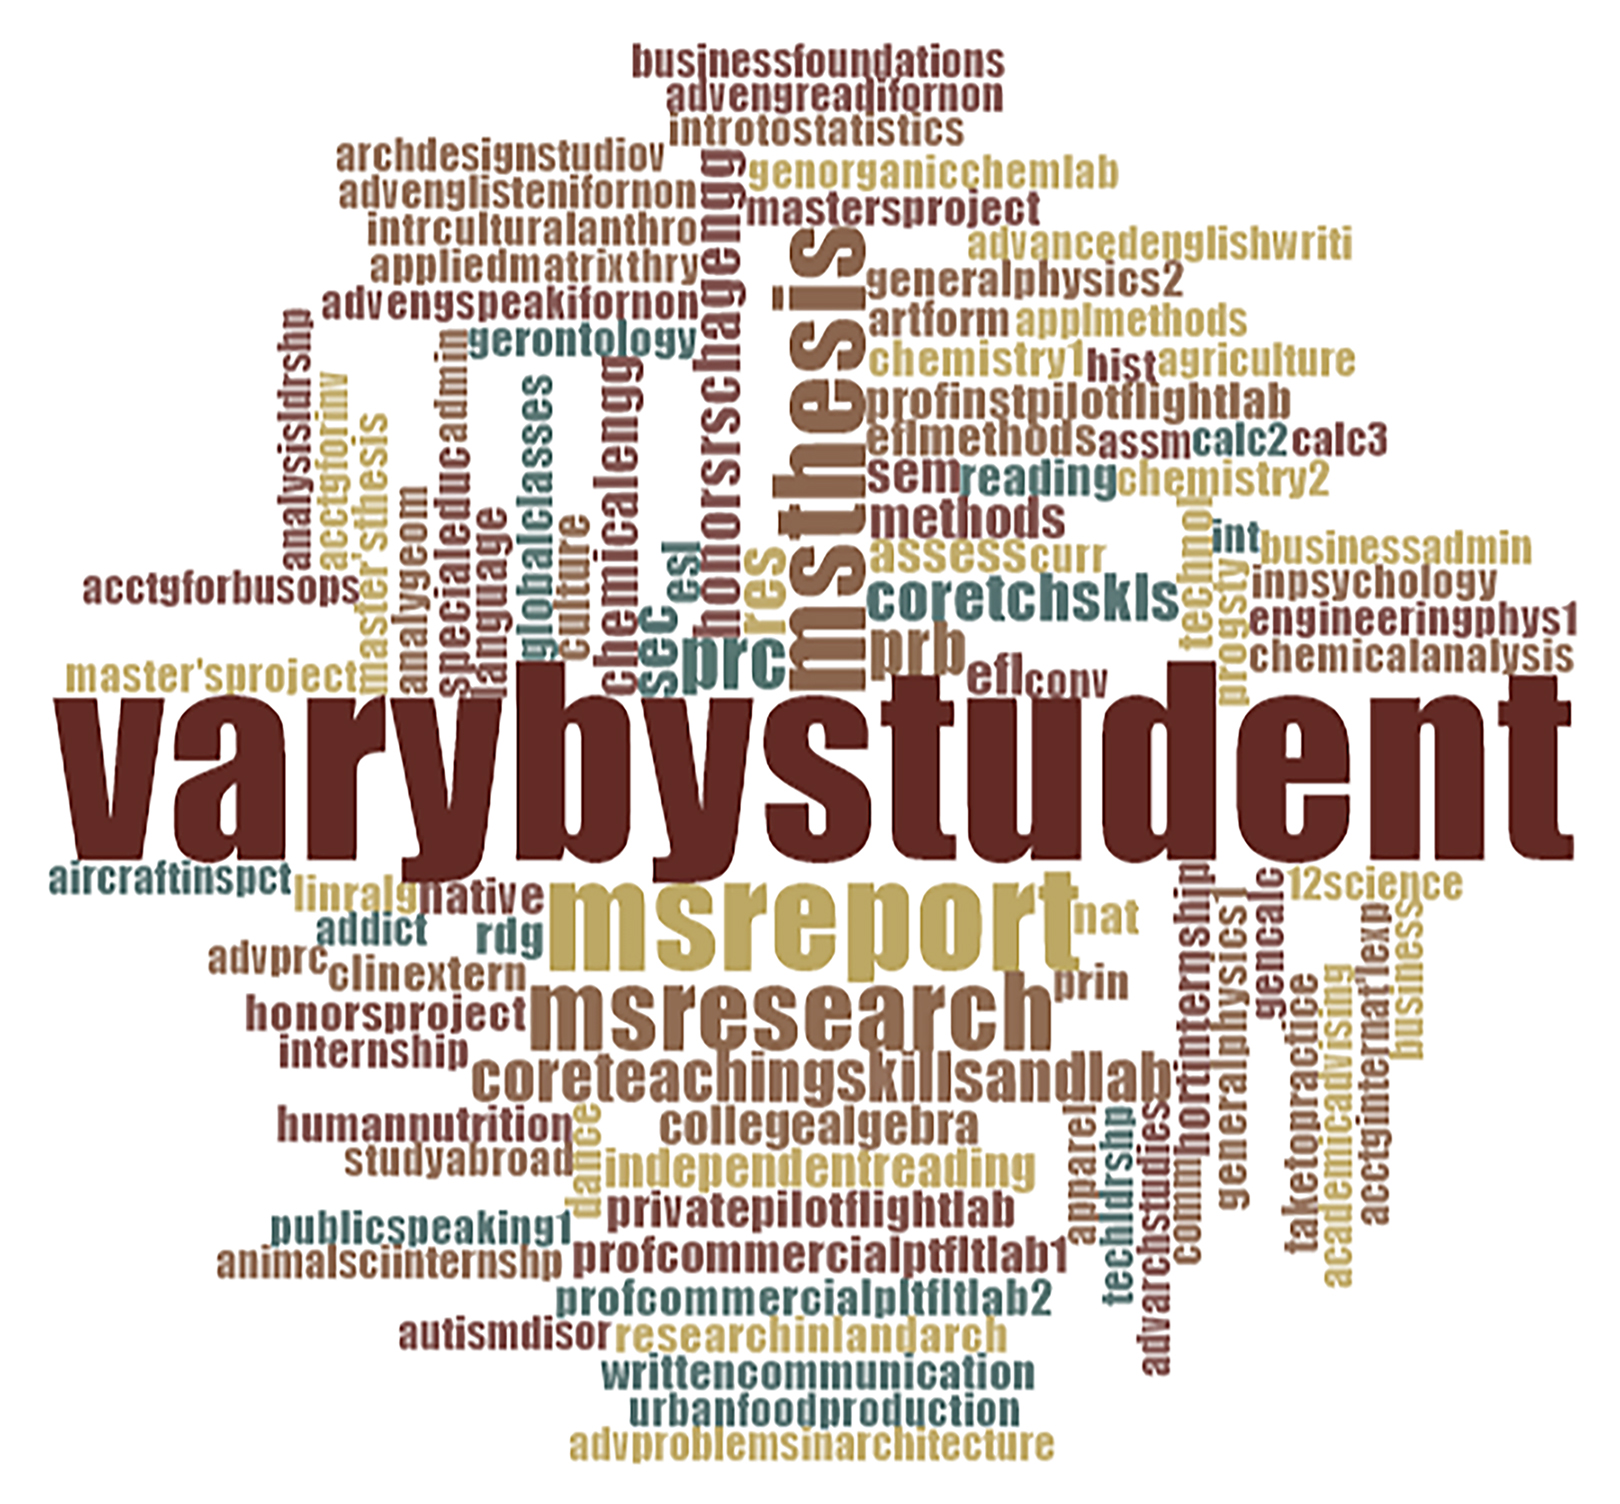
The list of unpublished courses in Summer 2017 include 1,255 courses. More about the course titles of these unpublished courses are available in Figure 15.
Figure 15: Unpublished Courses in a Word Cloud by Frequency Count (Summer 2017)
This article gives a brief look at some of the information available from Reports through the Admin access in the Canvas LMS. This is not a comprehensive overview of what’s available.
What was not included? There are data reports on SIS (student information system) exports. Another report involves learners enrolled in courses who have had zero activity thus far. (This may be useful for learning interventions, verification of participation for grant- and scholarship- releases, and so on.) There is a report for the last time users touched the system. This captures not only the formal user name but some other related data including IP (Internet protocol) addresses. There were some questionable entries, though, including a person who had long retired from the school apparently seen to “access” the system. All data should be scrutinized for accuracy, as in most cases.
The Reports section may well serve as an intermediary step between the front-end of the LMS and the data portal backend (which contains much more data than these reports).
The reports themselves offer discretized approaches or angles to the available data. They include some a priori structure in terms of assumed usages of the information. There is value in knowing the collected data, particularly in teaching, learning, and reporting contexts. There generally has to be a larger context to make sense of some of the data (except for the brief summary looks included here).
Some of the columns--time, identifier-based, and others--enable some querying across data tables; however, this will be for another day.
Note: This article is released with the permission of the system administrator / owner of the Canvas LMS instance at Kansas State University, Scott Finkeldei. Thanks!
About the Author
Shalin Hai-Jew works as an instructional designer at Kansas State University. She may be reached at shalin@k-state.edu.
| Previous page on path | Cover, page 17 of 26 | Next page on path |
Discussion of "Gleaning Insights from Canvas LMS Reports"
Add your voice to this discussion.
Checking your signed in status ...