rubbing every object and surface in betty's math classroom
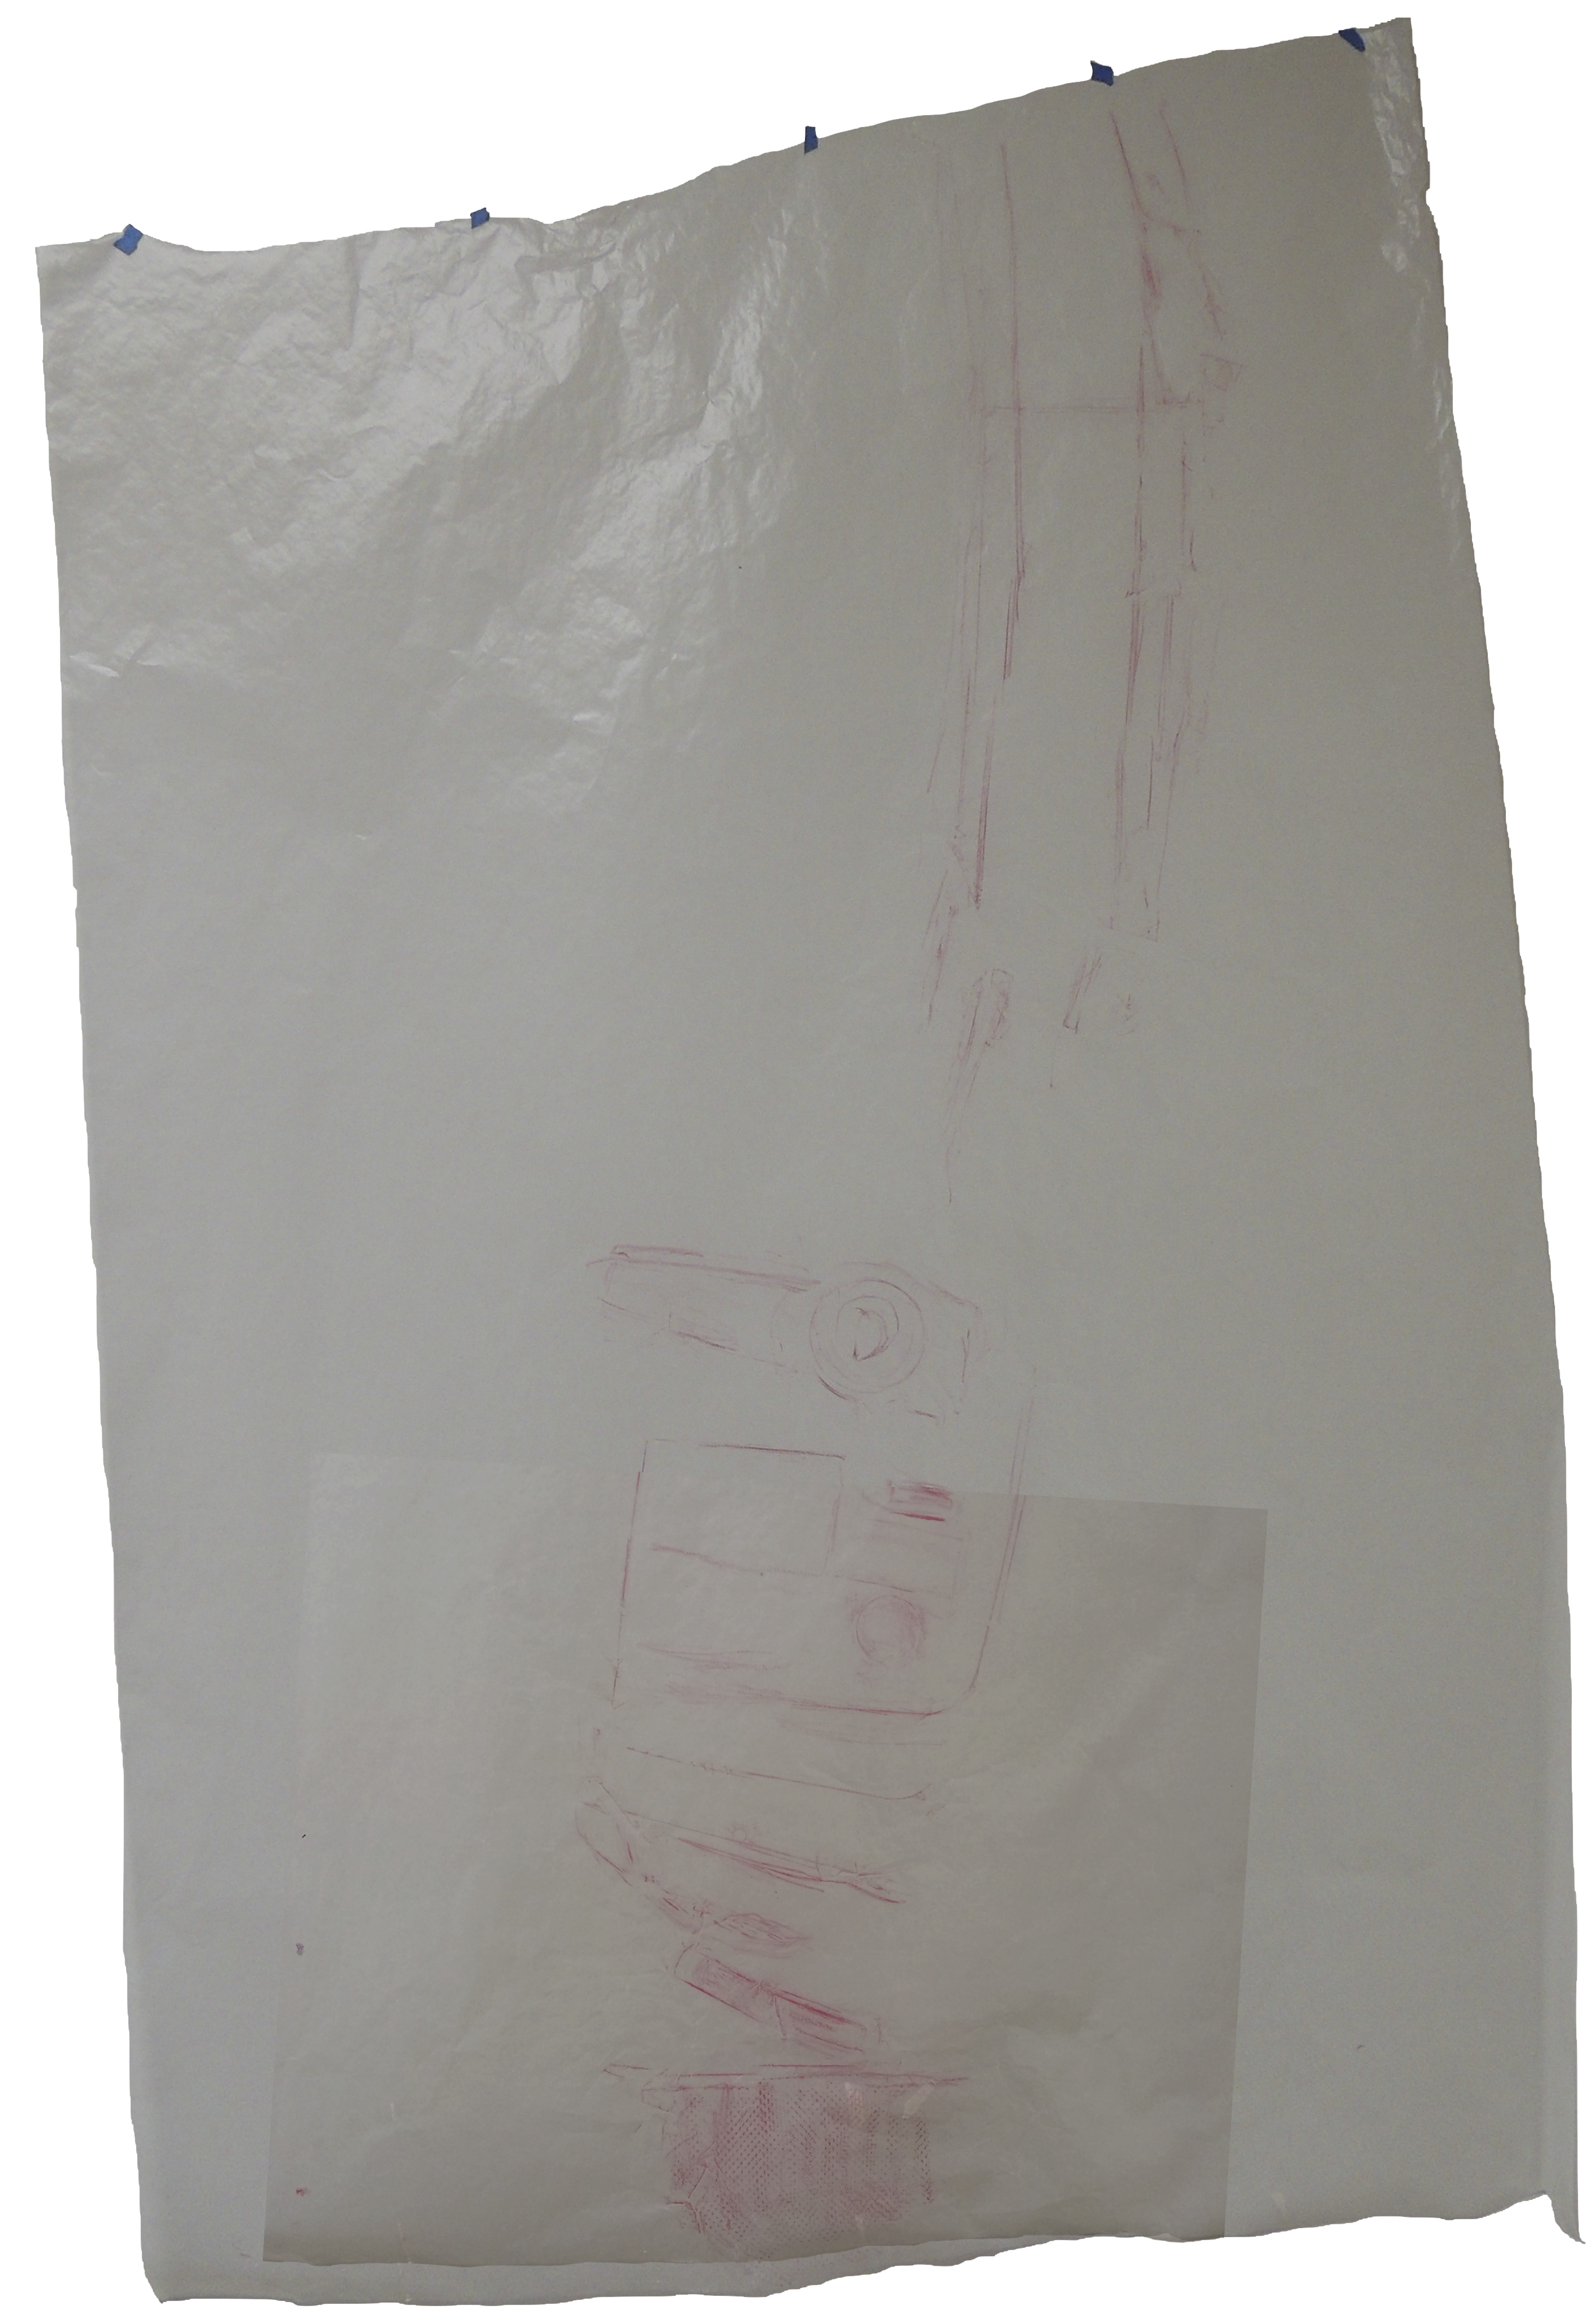
I stood perched atop the shiny surface of a student desk—left foot planted on the chair, right leg bent on the attached table, a curl of blue painter’s tape fixing the edge of glassine paper (a translucent tracing paper) to the flat top of Betty’s seven-foot particle board bookshelf. My eyes narrowed on the top row of books—muted teal bindings just visible through the onionskin curtain of glassine. How to position my hands to capture the interior angle of the shelf, the uneven slant of chipping board, the stepped silhouette of class texts? I flattened the crinkly paper to the shelf’s surface with my left hand and pressed the broad side of a red beeswax crayon to the objects with my right. Crisp, dark lines came through at right angles, softer marks as the paper pulled to accommodate the shelf’s three-dimensional form on a creased 2-D skim. I could begin to see the drawing emerge, recognizable referents alongside abstract notations—tight marks and wandering lines, a child’s hand, the record of skips or bumps (Fieldnote June 27, 2015).
On June 26 2015, the last workday of the school year for New York City public school teachers, I spent ten hours in Betty’s math classroom at Bronx Humanities making large-scale drawings on paper. I arrived before 8am with four, forty-three inch rolls of glassine, a wheel of painter’s tape, and a tin of rectangular crayons. I had come with a purpose: to trace every object and surface in her classroom using the early printmaking technique of rubbing—laying paper over objects and then lightly scrubbing the paper with a drawing tool, so that the raised surfaces darken, while recessed areas remain blank. My intention as the title announces, was to produce a scaled imprint of every surface and object, an index of Betty’s space and teaching tools. Each tile of linoleum, panel of slate board, textbook, and craft supply covered in the crinkly sheath and called forth through strategic wrapping, odd angles and the constant to and fro motion of my hand.
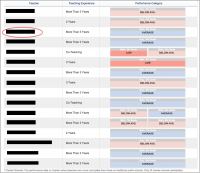
I had begun to conjure this ethnographic intervention several weeks earlier as a way to visually interrogate media representations of teacher evaluation. The images, and the process of creating them would be a counterpoint to the proliferation of de-contextualized digital depictions of teaching and teacher work like the value-added teacher ratings that were published amid great controversy[i] by media outlets including the Los Angeles Times, New York Times, and Wall Street Journal beginning in 2010. Figure 1, taken from The Wall Street Journal’s 2012 Grading the Teachers Project[ii] serves as an apt example of the image genre. This cropped screenshot depicts a table with three vertical columns—a list of sixteen teacher names (blacked out here) at the left; a phrase-long summary of the teachers’ classroom experience (2 years, more than 3 years, etc.); and a third column for “performance,” where teachers are assigned a ranking based on citywide averages. What at first appears to be a straightforward record of teacher proficiency, is actually an abstracted and stylized visual representation. For example, the teachers’ numerical value-added measurements (VAM)—already a reductive depiction of teacher work—are analyzed according to a scale ranging from “low” to “high” and then color-coded in blues and reds of varying chroma. These modifications, in the style of infographics, are designed to communicate complex information quickly and clearly (often precluding nuanced readings). They call on grammars of Newtonian science—practices of categorizing and the objectivity of numerical data—to bolster their visual authority.
I imagined the rubbings in dialogue with these value-added charts and tables in a series of aesthetic and conceptual “whereas” relationships. Whereas the VAM images are abstracted symbols, the rubbings would be mimetic representations; whereas the VAM images are digital (and therefore highly searchable, persistent, replicable, and scalable, as boyd 2007 elaborates) the rubbings would be analog; whereas the VAM images fit (by definition) onto a computer screen, the rubbings would be life (classroom) -sized; whereas the VAM images are aesthetically standard and universal—each school and teacher is depicted in the same font and style, the rubbings would be particular—the objects and spaces in a specific math classroom at a particular school; whereas the VAM images are certain, the rubbings would be less sure. And whereas the purpose of standardization serves to normalize and control (students and teachers), the aim of the rubbings towards thick description and particularity works to differentiate, to learn from aberrations and subjectivities. While digital modes and especially the graphic design quality of the VAM images come across as smooth and consistent, rubbings are necessarily textured, bumpy and uneven. The act of rubbing highlights every scrape and chip, every peel of paint, the imperfections of the objects and artist’s hand. The value-added graphics are the visual outcome of several cycles of abstracting and condensing volumes of teacher and student data—as if reducing fractions until the simplest form of the numerical relationship comes forward. The rubbings would be total, indexical, one to one.
images, image-making and adjacent parts
Conceived as a visual ethnographic assemblage comprised of the rubbings, my fieldnotes, and the embodied experiences of making them, I write about this work in terms of the images/ objects, process, and as a tool of visual research. The assemblage consists of four kinds of representations of the rubbings, each of which take up the aesthetic and theoretical frames of jumble/ collage.
-The first are photographs of individual rubbings—whole shots and full-bleed details. Unaltered, the rubbings are jumbled in their imprecision—hard-to-make-out marks, the abstract quality of the minimalist lines of a chalkboard, the glare of the camera on the shiny paper. These images invoke what cinema scholar Laura Marks’ calls “haptic visuality,” a term which she defines as “a kind of seeing that uses the eye like an organ of touch” (2004, p.82).
-The second are photos of the rubbings where the background has been digitally erased so that the images hang in empty space. These cut-outs highlight the materiality of the paper—diagonal sweeps and the three-dimensionality.
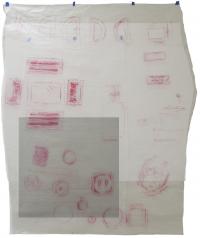
-In other images, I hung the paper rubbings on the wall in layered arrangements before photographing them (later cropping the ground). These playful images highlight dynamics of in/visibility—the faint traces of scissors coming through between the horizontal hash-marks of rulers—and put the objects in relational dialogue.
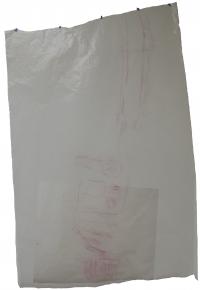
-Finally, in the fourth series, I layer different photographs of the same drawings—two long shots of the messy book case with a detail pasted around the center—to create a single, disjunctive representation. By combining different angles on the objects—at different ranges, with different shades of white/yellow/gray, different qualities of light and spots of glare, these collages take up art education scholar, Charles Garoian’s (2004) concept of collage as a space for “perspectival multiplicity.” Because the angles and perspectives of these images don’t fully resolve, they create a “cognitive dissociation” (p.48) that invites the audience to raise questions about if, how, and what these objects mis/represent.
I take up these different images in dialogue with my fieldnotes, teacher narratives, school context, and across three material and theoretical dyads: Witnessing/ Evidence; Positioning/ Art; and Care/ Tactile epistemology (Marks 2000). In and through these dyads, I consider what the work (assemblage) is—naming the image genre and its antecedents in art, anthropology, research and the literature—and what it does—how the work functions as a tool of meaning-making and analysis.
[i] And tragedy. Teacher, Rigoberto Ruelas committed suicide following the publication of teachers’ value added scores in the L.A Times where he was graded, “below average” (Lovett, 2010).
[ii] While evidence of the “Grading the Teachers Project” remains online in the form of articles, auxiliary videos, and references, the database is no longer available. Further, other New York City news organizations including DNA Info, the Daily News, and SchoolBook, which also designed searchable databases for school and teacher rankings have removed their sites as well.