K-Means Clustering
K-Means Clustering
K-Means clustering partitions a set of documents into a number of groups or clusters in a way that minimizes the variation within clusters. The "K" refers to the number of partitions, so for example, if you wish to see how your documents might cluster into three (3) groups, you would set K=3.
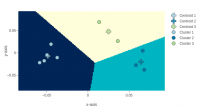
When considering visualizations of K-means clusters, we recommend that you think of each of your documents as represented by a single (x,y) point on a two-dimensional coordinate plane. In this view, a cluster is a collection of documents (points) that are close to one another and together form a group. Assigning documents to a specific cluster amounts to determining which cluster "center" is closest to your document. The image below shows a Voronoi visualization of a collection of texts in K=3 clusters.
The algorithm (general procedure or "recipe") for applying K-means to your collection of documents is described next. Again, the overall goal is to partition your documents into K non-empty subsets.
- Decide on the number of clusters you wish to form. So yes, you must pick a value for K a priori.
- The algorithm will compute a "center" or centroid for each cluster. The centroid is the center (mean point) of a cluster. The procedure for creating centroids at the very start can be varied and is discussed below.
- Assign each of your documents to the cluster with the nearest centroid.
- Repeat steps 2 and 3, thereby re-calculating the locations of centroids for the documents in each cluster and reassigning documents to the cluster with the closest center. The algorithm continues until no documents are reassigned to different clusters.
Required Settings:
K value: There is no obvious way to choose the number of clusters. It can be helpful to perform hierarchical clustering before performing K-Means clustering, as the resulting dendrogram may suggest a certain number of clusters that is likely to produce meaningful results. The K-means procedure is very sensitive to the position of the initial seeds, although employing the K-means++ setting can help to constrain this placement.
Method of Visualization:
Lexos provides three methods of visualizing the results of a K-means cluster analyses. In each case, Lexos first applies PCA (Principal Component Analysis) to reduce the dimensions of the data so it can be viewed in a 2-D or 3-D graph. The default method of visualization, Voronoi, identifies a centroid (central point) in each cluster and draws a trapezoidal polygon around it. This may be helpful in allowing you to see which points fall into which cluster. More traditional visualizations are also available as 2-D and 3-D scatter plots.