Index Visualization
The index visualization displays all content in the book in a grid format where each square represents one piece of content. Content is color-coded by type, and links between content are displayed on roll-over. Clicking a content element selects it, keeping its relationships visible even when rolling over other content, allowing multiple sets of relationships to be viewed simultaneously.
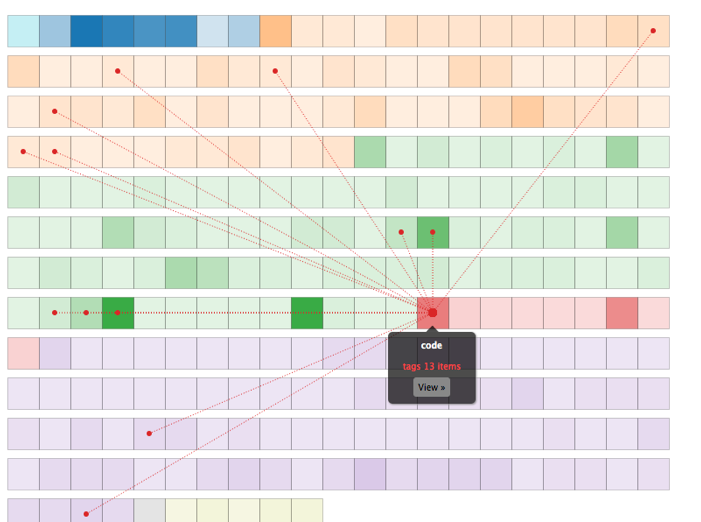
Double-clicking a square or clicking its "View" button opens the associated content (page or media file).
| Previous page on path | Visualizations, page 2 of 5 | Next page on path |
Discussion of "Index Visualization"
Add your voice to this discussion.
Checking your signed in status ...