Methodology
As explained on the previous page, collecting the most points in the regular season is the only way a team can guarantee a chance to play for the Stanley Cup, so each team strives to maximize their regular season points each year. I set out to see if there is a formula to determine point totals given team performance. The basic R statistics package was used to create this model, while Javascript code was written to present the model to users.
For the metric components of the model, I began by testing correlation in R by observing the coefficient of determination for each statistic and regular season point totals. The coefficient of determination, denoted R-squared, is known as the variance in regular season points explained by each game component. For example, roughly 49% of variation in point totals can be explained by the percentages of shots saved by the teams goalie. That is a high R-squared value, as hockey is clearly a complicated game, so nearly 50% of success being determined by one player's performance is astounding. Note that a team's success cannot be explained by a single metric, because no one player can carry a team to the Stanley Cup Playoffs. A team effort is necessary.
Using vast data regarding the 2015-2017 NHL seasons from NHL.com and stats.HockeyAnalysis.com along with my experience watching/tracking hockey, I used the five team metrics that appear objectively independent and have the highest R-squared values. In order to construct the model, the 2016-2017 NHL regular season data was used as training data, while the model's accuracy was assessed on the 2015-16 regular season data, known as testing data. Of the 27 metrics tested, thirteen had R-squared values greater than 20%, and from those thirteen, I selected the five final metrics using my domain expertise. Unfortunately, independence could not be assumed, as determining distributions and associations of different metrics would be illegitimate given only a single season of training data. My experience watching hockey, reading about hockey, and in particular reading a paper published by Emmanuel Perry [1] regarding player value regression modeling has given me insight into what makes a team successful. In other words, I selected metrics that seem to be best at predicting regular season success, while making sure not to include a single aspect of the sport multiple times. These metrics worked well together, meaning that the model as a whole carried a high r-squared value. In fact, the final model has an r-squared value of 87%, meaning 87% of variance in teams' regular season success can be explained by the model.
Upon reaching the final model, I tested the data to ensure a viable model had been made. First, the data must not contain outliers or influential observations. Based on scatterplots and testing the model without potential outliers, no influential observations were found. Next, residual plots were analyzed to assess trends in the model. In statistics, residual values represent the difference between the observed value (true regular season point totals) and the predicted values (the model's best guess of point totals). The regression model was clearly linear, and the variance appeared random. Again, there were no outlying residuals and the error terms (actual observed results as compared to linear model) were normally distributed around the linear model. This was confirmed with plots of the residuals against the model as well as histograms and box plots of the residuals.
Of the nearly 30 metrics assessed for linear relationships, these 5 metrics stood above the rest: blocks, power play percentage, penalty kill percentage, PDO% in close 5v5 situations, and Fenwick For % in close 5v5 situations. These metrics will be thoroughly explained on the following page.
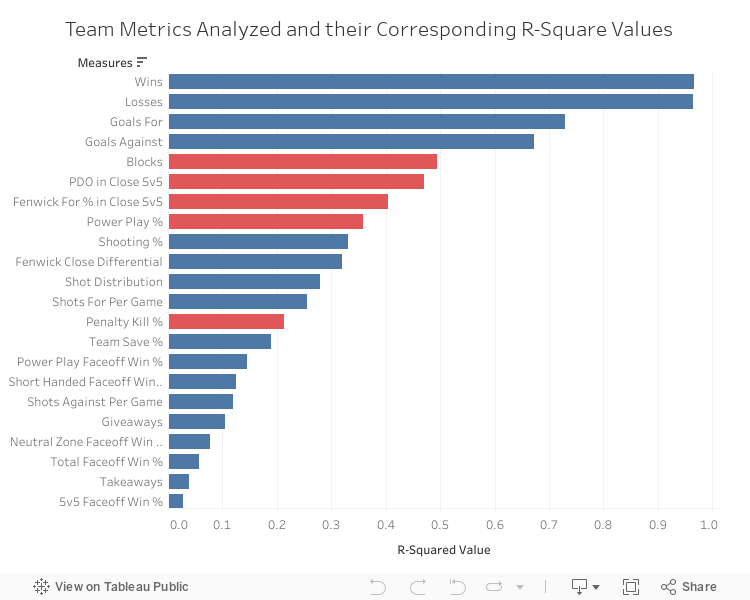
As you can see above, each of the 27 metrics are listed. The red bars indicate the metrics included in the final model, while the blue metrics were not. Mouse over each bar to see the corresponding R-squared values and the reason for not including the twenty-two other metrics in the final model.
Once this model was created, I used the help of JSCalc.io to write a Javascript calculator to predict point totals. From these point totals, the calculator, using a simple linear regression model created based upon the past twelve years of NHL data, provides a probability of a team making the playoffs, given their team metrics. This is based upon point totals of all playoff and non playoff teams since 2005, when the point system was modernized. Therefore, the model is based upon concrete data, though I acknowledge the Division changes in 2013 offseason may have altered the likelihood of making the playoffs. However, I chose to use 12 years of data to avoid sparse data from only four NHL seasons. Because of this, the playoff likelihood predictor is based upon much smoother data, and thus is more reasonable.
[1] Perry, Emmanuel. "Composite Tailored Regression Modeling For Evaluative Ratings in Professional Hockey." June 16, 2016. Accessed July 2, 2017.