
Page Layouts in Scalar 2: Splash Pages and Image Headers
 Figure 1. Book Splash Layout. Taken from Steve Anderson’s Bad Object 2.0: Games and Gamers.
This is the third installment in a series on our new page layouts in Scalar 2. If you missed the others, you can view them here, and here.
Many of you know how to use our splash and image header layouts. In fact, more and more, we’re seeing really stunning uses of splash pages in new Scalar projects.
But we still get questions, from time to time, about selecting images for splash pages and the image header layout as well as queries about the differences between our two types of splash pages. So let’s start there.
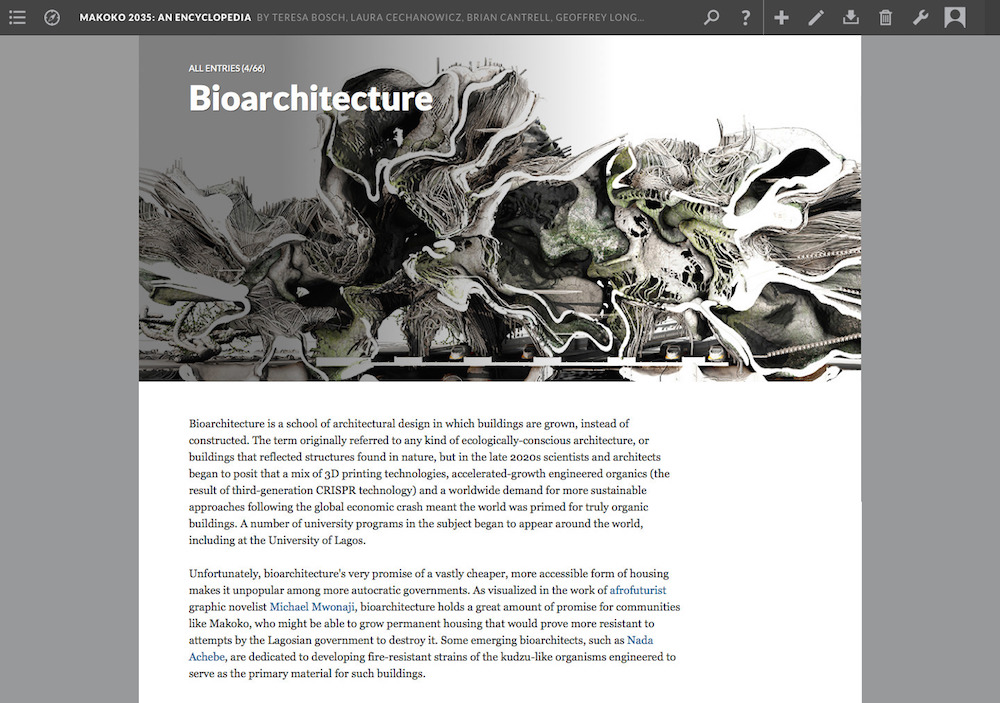
The Image Header layout displays the page’s “key” image as a header, with the title and description of the page overlaid. The rest of the page follows the Basic layout, with text and media interspersed (see Figure 3). Splash layouts display the page’s “key” image full screen, with either the page’s or project’s title at the bottom. If the page is part of a path or is itself a path, a navigation button is shown below that title (see Figure 1).
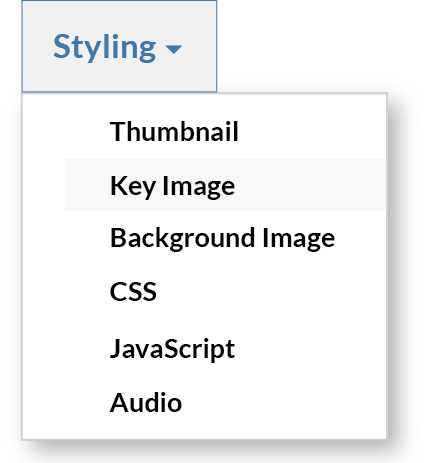
Setting a page to either a Splash or Image Header layout is a two-step process. First, choose the image you’d like displayed either full screen, in the case of the Splash layouts, or at the top of the page, in the case of the Image Header layout by selecting “Key image” under “Styling” in the page editor (see Figure 2). Second, select your layout from the “Layout” drop down menu, also in the page editor. In the case of Splash layouts, you’ll have two choices: Splash and Book Splash. The Splash layout will display the title of the current page over the image you’ve selected. The Book Splash layout will display the title and author(s) of the entire project, over your selected image. In addition, if the page you’ve set to either Splash or Book Splash layout is the parent page of a path, the layout will include a “Begin with…” button at the very bottom of the page (see Figure 1), or if the page is included within a path, a “Continue to…” button.
Book Splash layouts are perhaps best used for the landing page of a project while Splash layouts can be used to good effect in introducing sections, chapters or individual essays within a project. In fact, if you use the same image you’ve chosen for the splash page introducing a section as the background image for all the pages in that section, you can effectively visually delineate it from other sections within the same project. The Image Header layout can be used in a similar fashion.
Page Layouts in Scalar 2: Google Maps
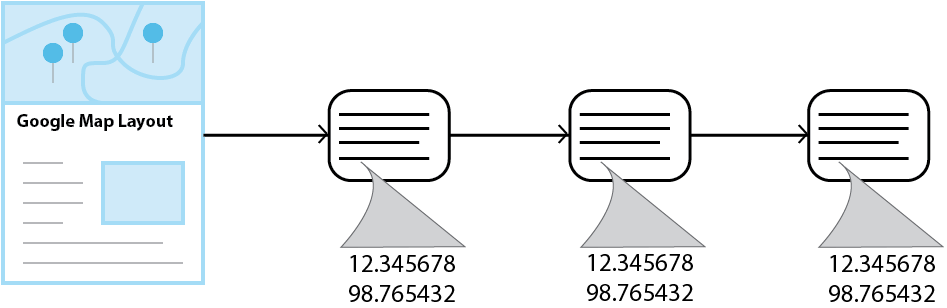
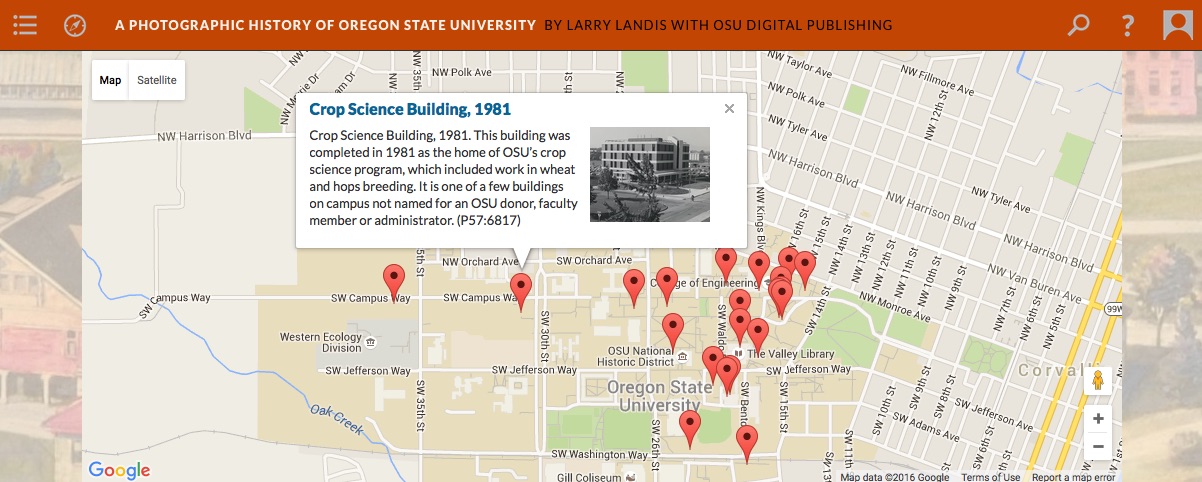 Figure 1. Google Map Layout. Taken from Larry Landis’ A Photographic History of Oregon State University.
This is the second installment in a series on new layout options in Scalar 2. If you missed our prior piece on Media Gallery layouts, you can always view it here. Today we’ll be discussing the new Google Map layout.
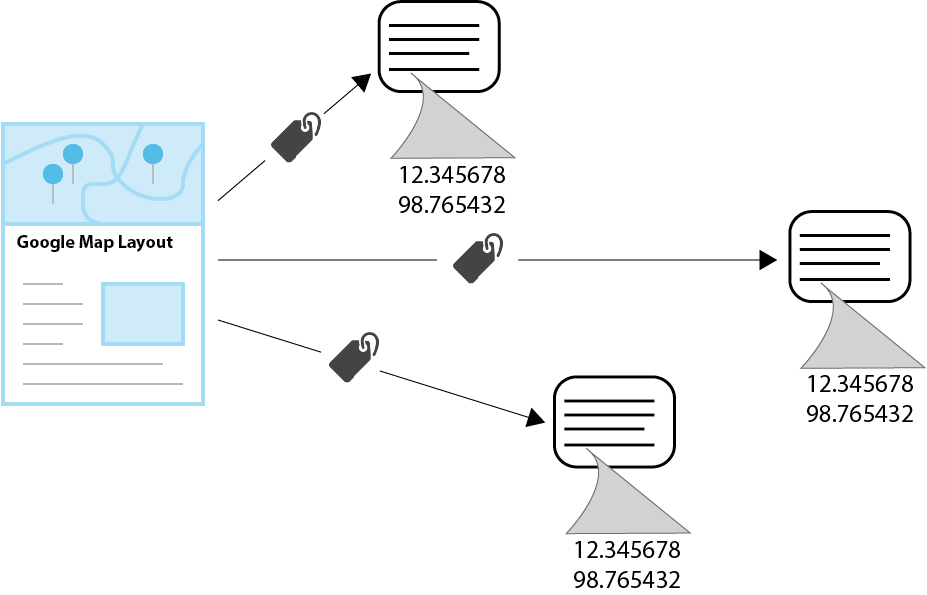
The Google Map layout plots the current page plus any content it contains or tags on a Google Map embedded at the top of the page. Every item to be plotted must include either dcterms:coverage or dcterms:spatial metadata in the format of decimal latitude, decimal longitude. Each pin shown on the map will reveal the title, description, thumbnail and link for its content when clicked (see Figure 1). The rest of the page follows the Basic layout, with text and media interspersed.
Let’s walk through an example. I’m writing about architecture in Los Angeles. At this point my project contains several paths each of which cut through my material along a different vector. For instance, my readers can move along one path containing pages relating to individual architects; another related to design movements; and yet another containing pages related to specific architectural icons in the Los Angeles area. This third path is arranged chronologically, acting as a kind-of timeline for cutting-edge architecture in LA. But I’d also like my readers to be able to navigate those same pages discussing individual architectural structures geographically, not just chronologically. That is, I’d like my readers to be able to navigate those same pages -those same architectural icons- by way of a map.
Here’s how I’d go about doing this in Scalar.
Step one: Gather metadata. First, I’d collect the latitude and longitude, expressed in decimal degrees, for each of the architectural structures I’d like to plot on a map.
Step Two: Add metadata. Second, I’d go to each of the pages discussing individual architectural icons and add metadata to those pages. In other words, I’d (1) go to the page in my Scalar project where I discuss the LAX Theme Building; (2) click on edit to go to the edit page; (3) click on “Metadata” just below the text editor on the edit page; (4) click “Add additional metadata”; (5) within the dialogue box that pops up, tick the box under “dcterms” for either “spatial” or “coverage”; (6) click “Add fields” at the bottom-right of the dialogue box; (7) enter the latitude and longitude for LAX (in this case, 33.9425° N, -118.4081° W) into the new field that I just added under metadata called either “dcterms:spatial” or “dcterms:coverage” (depending on which field I selected); (8) save the page. I’d repeat these steps for each of the pages I’d like to plot on the map, in each case, inputting the appropriate latitude and longitude. I’d then have several pages in my Scalar project, each discussing an individual architectural structure with geospatial metadata for the location of that structure added to its respective page.
Click on graph to enlarge.
Step three: Create a page that pulls your material together. Third, I’d create a page, called, for example, “Architectural Icons in Los Angeles” and then either (1) tag that page (“Architectural Icons in Los Angeles”) to all the pages for individual architectural structures to which I just added geospatial metadata (see Figure 2) or (2) make that page (“Architectural Icons in Los Angeles”) a path and select as items in that path all the pages for individual architectural structures to which I just added geospatial metadata (see Figure 3).
Click on graph to enlarge.
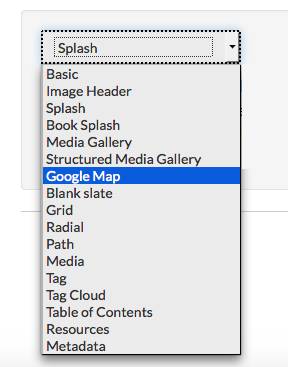
Step four: Select the Google Map layout. Finally, I would set “Architectural Icons in Los Angeles” -the page that tags or contains the other pages- to the Google Map layout. To do this, I’d click edit on “Architectural Icons in Los Angeles,” and, once in the page editor, select “Google Map” from the drop-down menu under “Layout” (see Figure 4).
In addition, the Google Map layout will also plot the current page -in our example here, the “Architectural Icons in Los Angeles” page- if it too has geospatial metadata associated with it.
But pages aren’t the type of Scalar content one can plot on a map. Once again, Scalar’s unique organizing principle in which everything is equal to everything else means that anything can do everything to anything else. In this case, it means all elements in a Scalar project can be plotted on a Google map. Or more specifically, it means that all items in a Scalar project can both have metadata associated with them and be added as a path or tagged to a page that is set to the Google Map layout. Have a set of photos taken around Los Angeles? Add geospatial metadata to those photos in Scalar and tag them to a page set to a Google Map layout. Have a video clip of twenty famous scenes all shot in Los Angeles? Annotate the video calling out those locations, add geospatial metadata to each of those annotations and then tag those annotations to a page set to the Google Map layout. Have ten short stories that each take place in a different area of Los Angeles? Make each of those stories a path in Scalar, add geospatial metadata to each of those paths (i.e. to the parent page of each path) and then tag those paths to a page set to the Google Map layout. Because tags, paths, pages, annotations, media objects and readers comments are all equivalent in Scalar, structural features -in this case, the Google Map layout- are incredibly flexible and extensible.
See you next time, when we’ll talk about the Image Header and Splash layouts.
Page Layouts in Scalar 2: Media Galleries
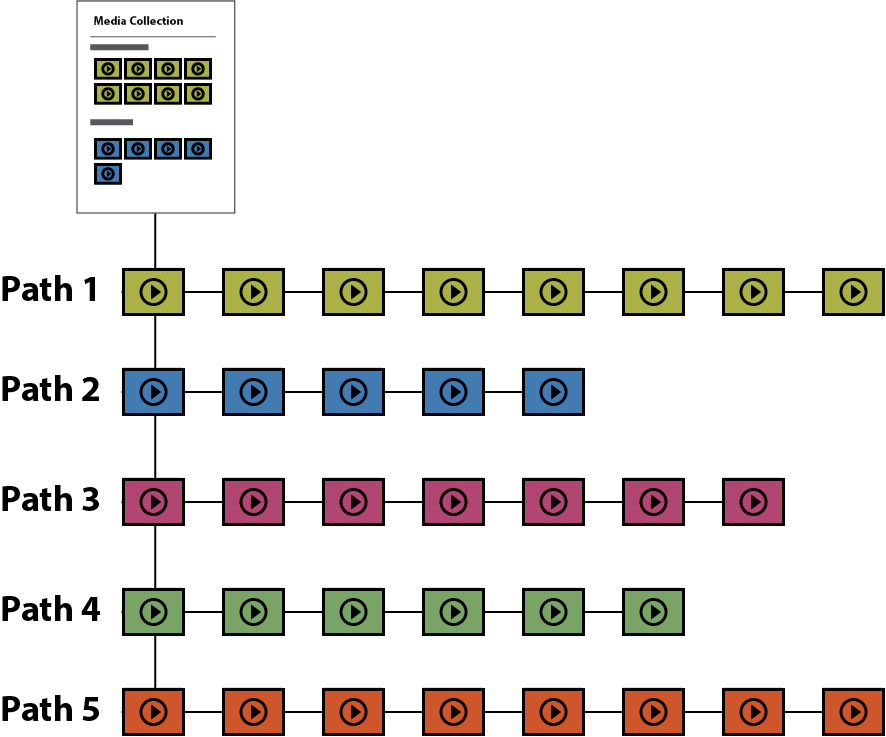
 Structured Media Gallery. Taken from Jacqueline Wernimont et al’s Performing Archive: Curtis + “the vanishing race”.
Scalar 2 was developed in an effort to give books composed in the platform greater versatility and visual impact while also making them easier to read and navigate. To this end, we added several new page layouts options, allowing users to choose, with more precision, the look, arrangement, and in many ways, the function of individual pages within a project. In the coming weeks we’ll be blogging about those various options, which include, among others features, an image header, splash images, visualizations, and a Google Map that plots geo-reference Scalar content. Today, we’ll be talking specifically about our two media-focused layouts: the Media Gallery and the Structured Media Gallery layouts.
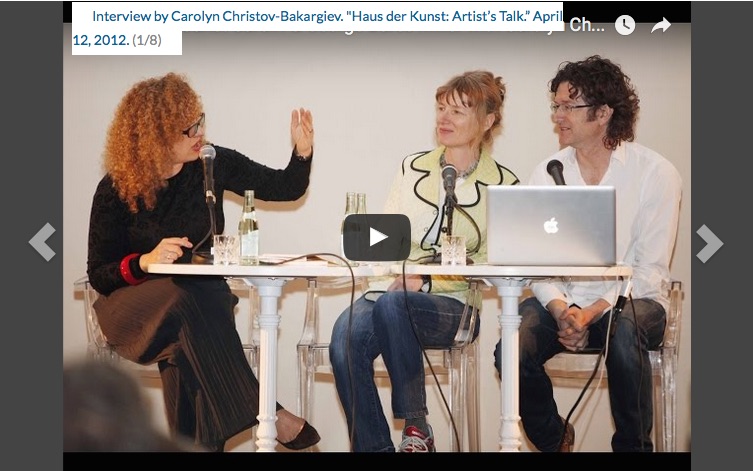
Our Media Gallery layout gathers all media objects inserted on a page as well as all media objects associated with the page -that is, all media object that have been tagged by the page or are in a path contained by the page- and displays them in a flip-through media carousel. Put another way, if you insert several images on page and then set that page to the Media Gallery layout, those images will appear in a carousel at the top of the page. If instead, you tag that page to several videos or make that page a path that includes a series of videos, those videos will also show up in the carousel.
The Structured Media Gallery layout functions in a similar fashion, but with a few key differences. Pages set to the Structured Media Gallery layout will display media associated with that page, not in a carousel, but as a collection of thumbnails. More importantly, it will not only gather media that are associated with the current page, but also media that are associated with its associated pages. Meaning, it will not only display media that are tagged or contained by the current page, but also media that are tagged or contained by pages that it tags or contains.
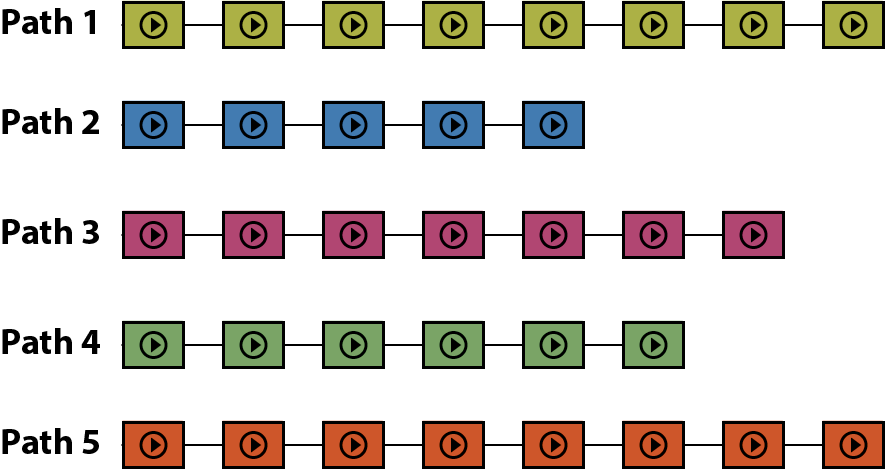
Let’s take an example. A user wants to create a collection of media used throughout their project; they want to split that collection into several mini-collections, for instance, based on themes; and they want to display the whole collection, made up of those mini-collections, all on the same page. To do this, a user would first build the mini-collections of media objects by creating paths for each –that is, creating a path for one theme, selecting the media objects that are contained in that path and then doing the same for other themes (remember, in Scalar, you can put anything on a path; not just pages, but media as well) (see figure 2). Second, they would create a top level path –say, called Media Collection- put the thematic media paths they just created on that path (again, in Scalar, you can put anything on a path, including other paths) and set that top level path to Structured Media Gallery (see figure 3). The result would be a page that displayed all of the mini-collections (paths), together, each under its respective title (see the example of the Structured Media Gallery in the header image to this article).
Pages set to the Structured Media Gallery layout will also gather and display media objects that have been tagged to the current or associated pages. So between paths and tags, there are any number of combinations one can use. Meaning, you could get the same result as above, were you to tag several paths of media objects or tag several pages that tag media objects or create a path of pages that tag media objects. The Structured Media Gallery layout will latch onto any parent to child to grandchild set of relationships in Scalar.
But, of course, one doesn’t have to use the Structured Media Gallery layout as a way to aggregate media objects two levels removed from the current page. One can also use it to gather media associated with the current page, as with the Media Gallery layout. But in this case, that media will be displayed, not in a carousel, but as thumbnails. Jason Mittell for instance, has done this to great effect, in his Complex TV, creating a thumbnail gallery of clips used across his book.
UBC Press and the University of Washington Press Receive Mellon Grant to develop indigenous studies publishing platform using Scalar

Thanks to a generous grant from the Mellon Foundation, UBC Press and the University of Washington Press will work with the Scalar team to develop a digital platform for publishing multimedia books in Indigenous studies. The publishing platform will offer a suite of tools for linking data and analyses to digital content from around the world and for interacting in culturally sensitive ways with heritage materials, ranging from clothing, beadwork, weapons, and tools to songs, stories, and dances. It will provide authoring teams with customizable methods to label content and inform readers about Indigenous cultural protocols for access and use of specific content.
Scalar will sit at the center of this project, constituting the core infrastructure upon which the publishing platform will be built as well as the reading interface in which the multimedia books will appear. Our team will also work to develop significant new functionality for Scalar as part of this grant, including the ability to import media with Traditional Knowledge (TK) labels and to properly display those labels for readers viewing the media. In addition, the Scalar team will develop a new middleware media importer dubbed “Tensor.” As a stand-alone platform, Tensor will sit between online archives and Scalar projects and allow users to browse archives, create playlists of media they find there and sync those playlists to one or more Scalar books.
We look forward to working with the wonderful people at UBC Press and the University of Washington Press on this project.
Happy Day of DH from Digital Humanities at Claremont Colleges
 Craig Dietrich introduces DHarmony to Claremont Colleges Faculty, Staff, and Students.
Happy Day of DH Everyone!
We’re here at the Claremont Colleges for the DHarmony event hosted by the Digital Humanities at Claremont Colleges. Craig Dietrich, Scalar’s own Info Design Director, and the Director of the Digital Humanities Studio at the Claremont Colleges, Ashley Sanders, Digital Scholarship Coordinator for the Claremont Colleges Library, and Daniel Chamberlin, Director, Center for Digital Liberal Arts at Occidental College, will be introducing many eager faculty, staff, and students here to tools and methodologies in DH. What a fitting way to celebrate Day of DH!
Duke University Press and NYU’s Hemispheric Institute of Performance and Politics Collaborate on Scalar Projects
Duke University Press has just announced the launch of two new Scalar works published in collaboration with the Hemispheric Institute of Performance and Politics at New York University.
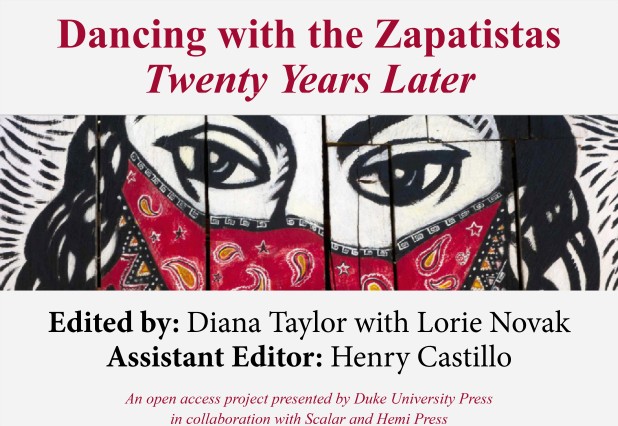
Dancing with the Zapatistas, edited by Diana Taylor and Lorie Novak, explores the history, culture and life of Zapatistas through essays, photo essays, interviews, as well as spoken word and theatrical performances. The work offers insights into the workings of the Zapatista Council on Good Government; the murals in the Caracoles; the Escuelita; Subcomandante Marcos; and Zapatista music and celebrations.
What is Performance Studies?, edited by Diana Taylor and Marcos Steuernagel, seeks to explore the depths of the field by posing the title’s question to thirty leading scholars from seven different countries throughout the Americas and then documenting their answers. The book features video interviews, transcribed, translated, and subtitled into English, Spanish, and Portuguese, accompanied by short essays.
See more from Duke University Press, here.